Fato Público
The day before the first round, I built a voting machine simulator. Three weeks later, it was the live results page for Brazil's 2026 elections, with a map, a scoreboard and bulletins from the TSE (Brazil's electoral court) in real time, plus an Instagram profile whose Reels reached hundreds of thousands of views. Now it's becoming a public-data portal: who represents you, how they vote and how much they spend. I conceived, designed and coded the entire product, with one rule that never changes: no sides, just facts.
Results
Platform · fatopublico.com.br, runoff night
Instagram · @fato_publico, in the profile's first 5 days
Site: my own analytics, with no cookies and no stored IPs. Instagram: the profile's professional dashboard, October 26–27, 2026. This case is ongoing: the portal is just getting started.
Context
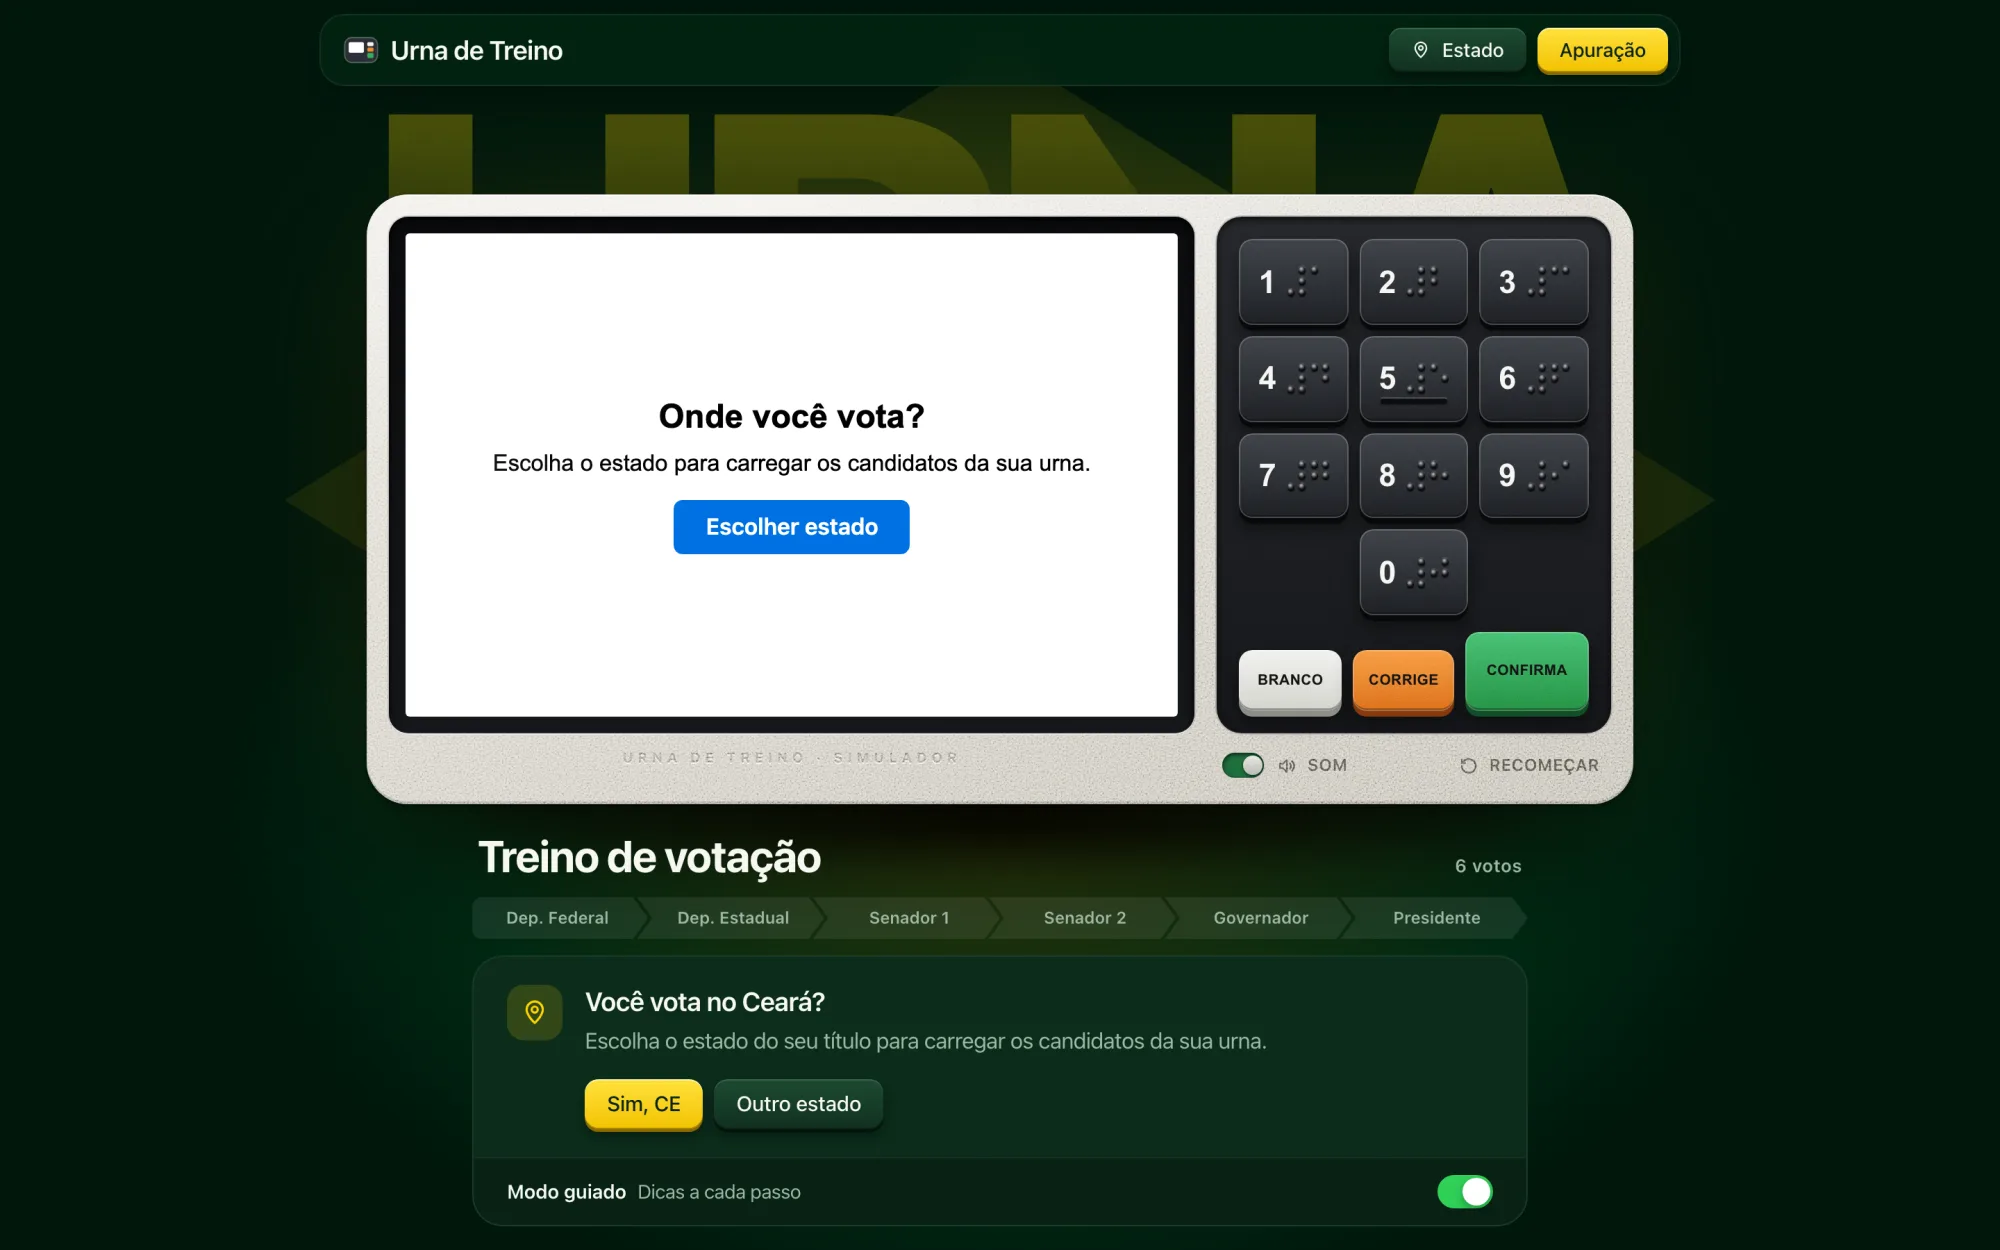
It started on October 3, 2026, the day before the first round, with a simple question: can you practice your vote before you get to the voting machine? I built Urna de Treino ("practice voting machine"), a faithful simulator of Brazil's electronic voting machine (16:10 screen, braille keypad, the one-second lock on the "Confira seu voto" review screen), loaded with each state's real candidates from the TSE's open data.
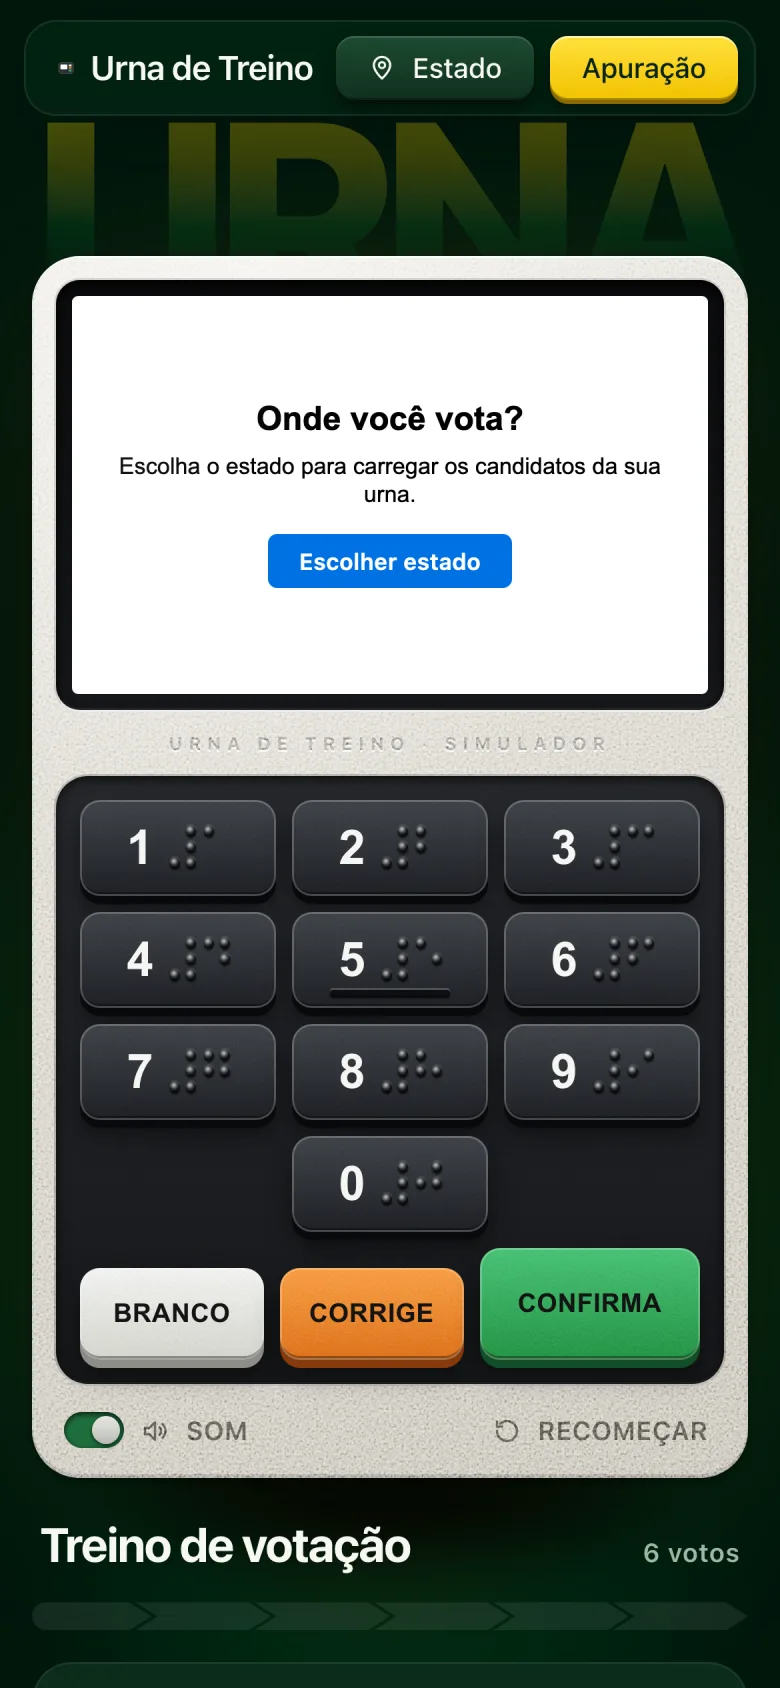
The machine opens by asking where you vote, loads that state's candidates and walks you through the six steps of voting. On a phone, the keypad spans the full width, sized for a fingertip.
The first live count
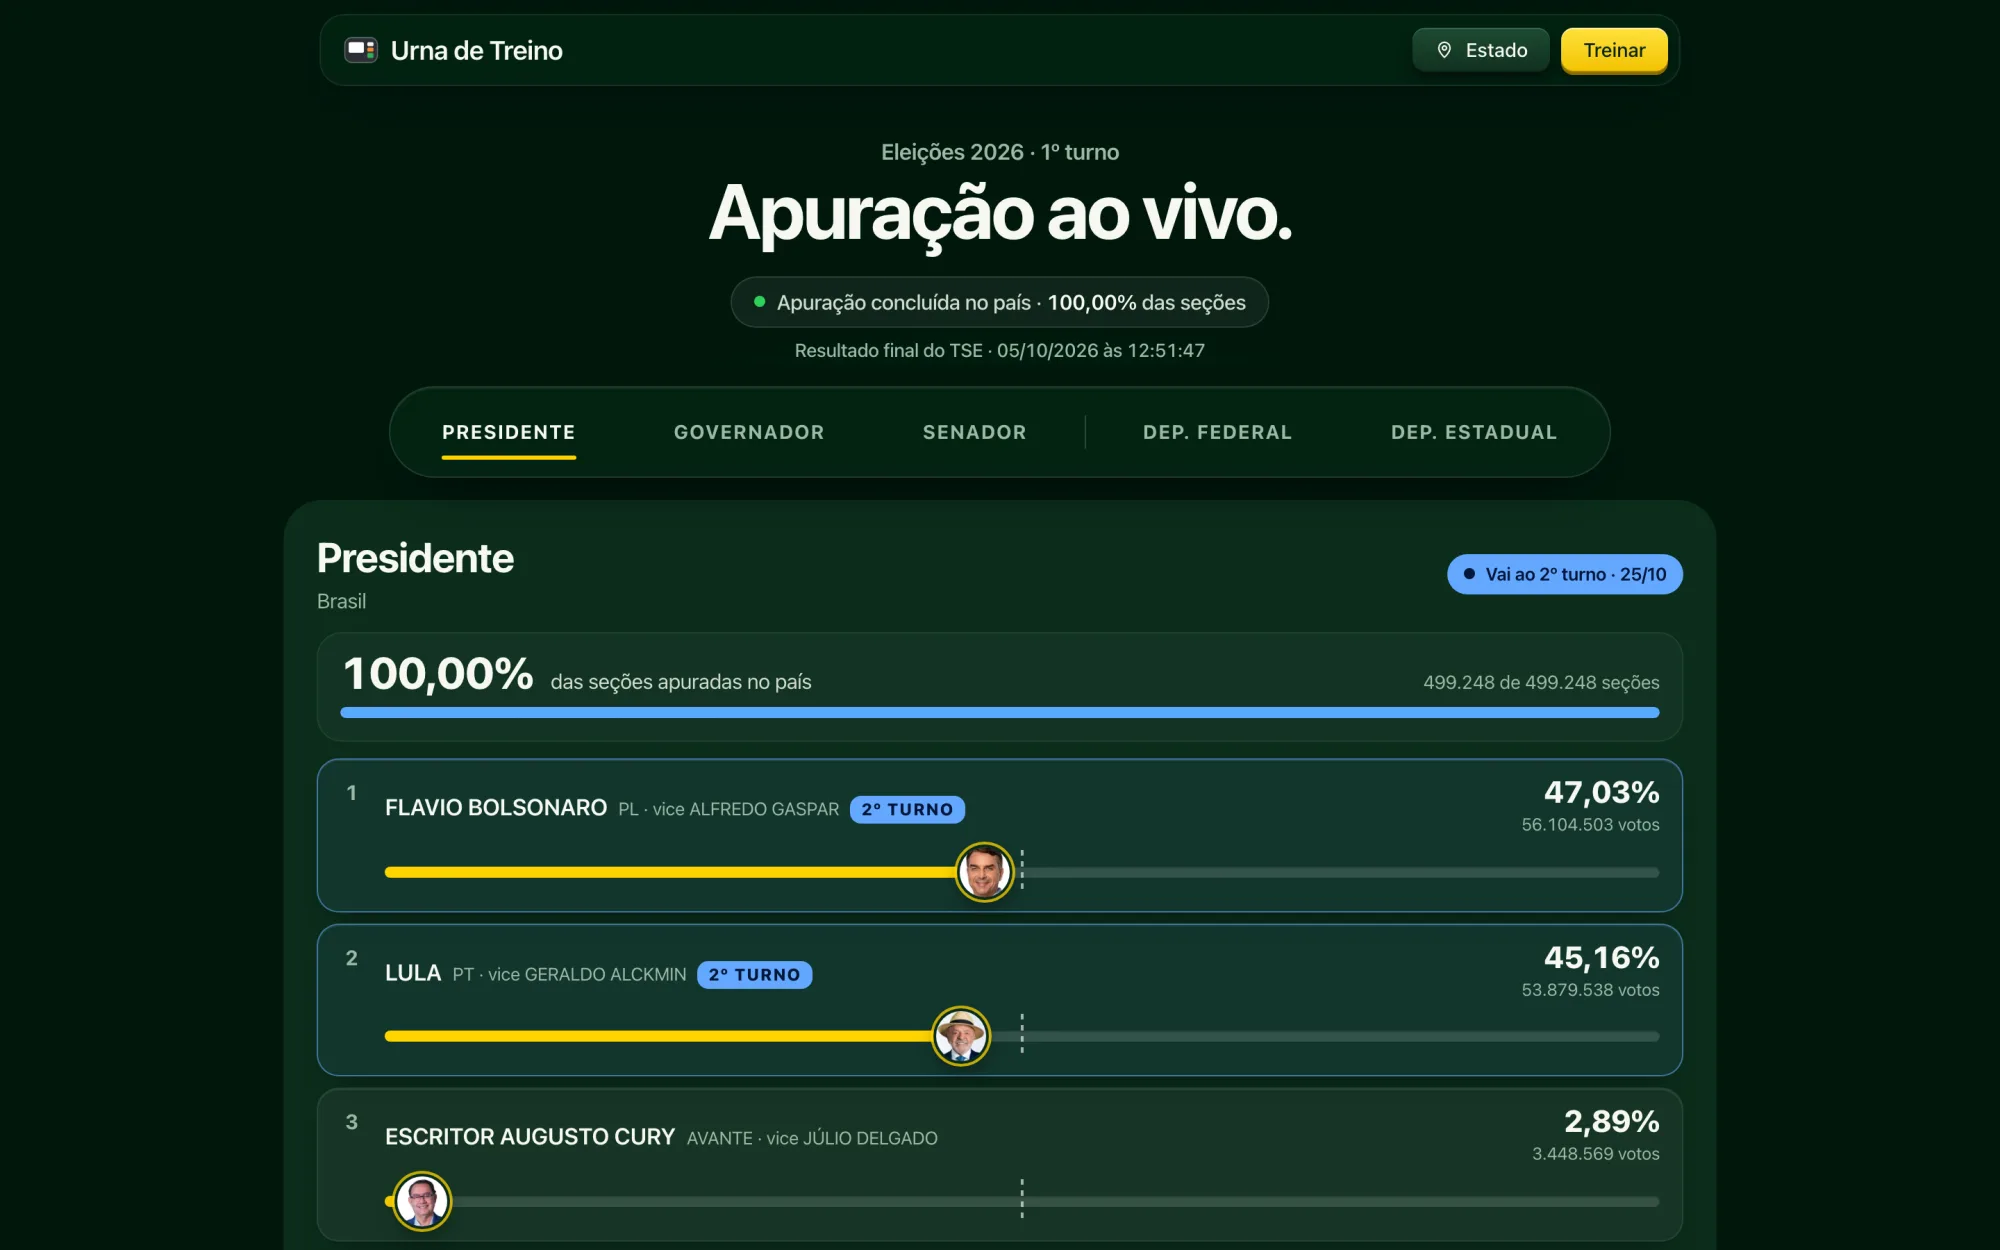
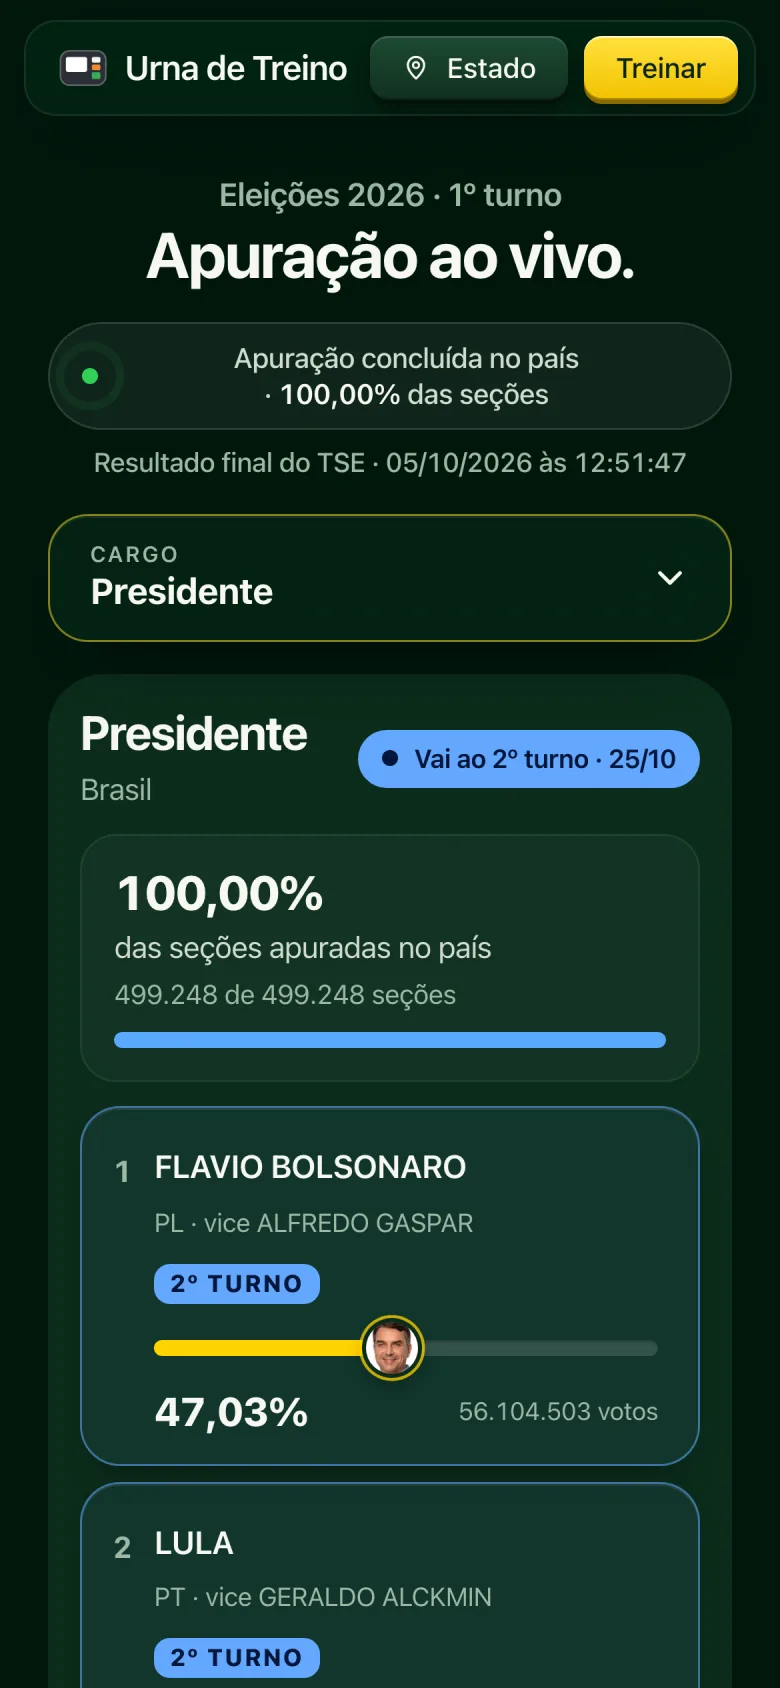
On first-round night, October 4, Urna de Treino got a results page, built and shipped that same day: tabs by office (president, governor, senator, representatives), the top five with bars that move with every bulletin, the 50% line and polling of the TSE every 10 seconds.
- "Elected" only from the TSE. When the math guarantees the win, the label reads "mathematically elected"; the word "elected" waits for official confirmation.
- The Chamber taking shape. All 513 seats in an arc, filled state by state as each one finishes counting.
- Browser alerts. Anyone who opted in got a notification when the count began.
It worked, and it exposed its limits: a list tells you who's ahead, but not where or how much is left. For the runoff, the results page became a dashboard with a map, and the project got a name of its own. On October 6, Fato Público ("Public Fact") was born, with the motto that has guided every decision since: Sem lado. Só fatos. (No sides. Just facts.)
The challenge
One night, no second chance. The runoff count lasts only a few hours. The site had to withstand traffic spikes, read the TSE's files without getting blocked (the TSE server blocks anyone who requests too much at once) and show each bulletin seconds after it came out.
Neutrality on a charged subject. In a polarized year, any detail reads as taking sides: a highlight color, the order of names, an adjective. The product had to be trustworthy for people voting for either candidate.
People on their phones, late at night. Most people follow along on their phone, often while watching TV. It had to read at a glance: who's leading, how much is left, what changed.
Method
I worked from a handful of principles, written before the first screen and enforced in every release:
- No sides. Each candidate gets their party's color, and nothing more. The brand yellow never highlights a candidate's number. "Elected" only appears when the math guarantees it. Demos use made-up names, never a real candidate winning with fake numbers.
- Less is more. A lean interface, little text, no scrolling pop-ups. If a data point doesn't help people understand the night, it goes.
- Mobile that feels like an app. A fixed bar, bottom sheets, full-width buttons and empty states designed for the small screen.
- A lightweight site. Only transform and opacity are animated, the big map is never fully repainted, and heavy data (5,570 municipalities) only loads when someone looks.
- 4 px grid. Every spacing value is a multiple of 4 or 8.
Runoff night
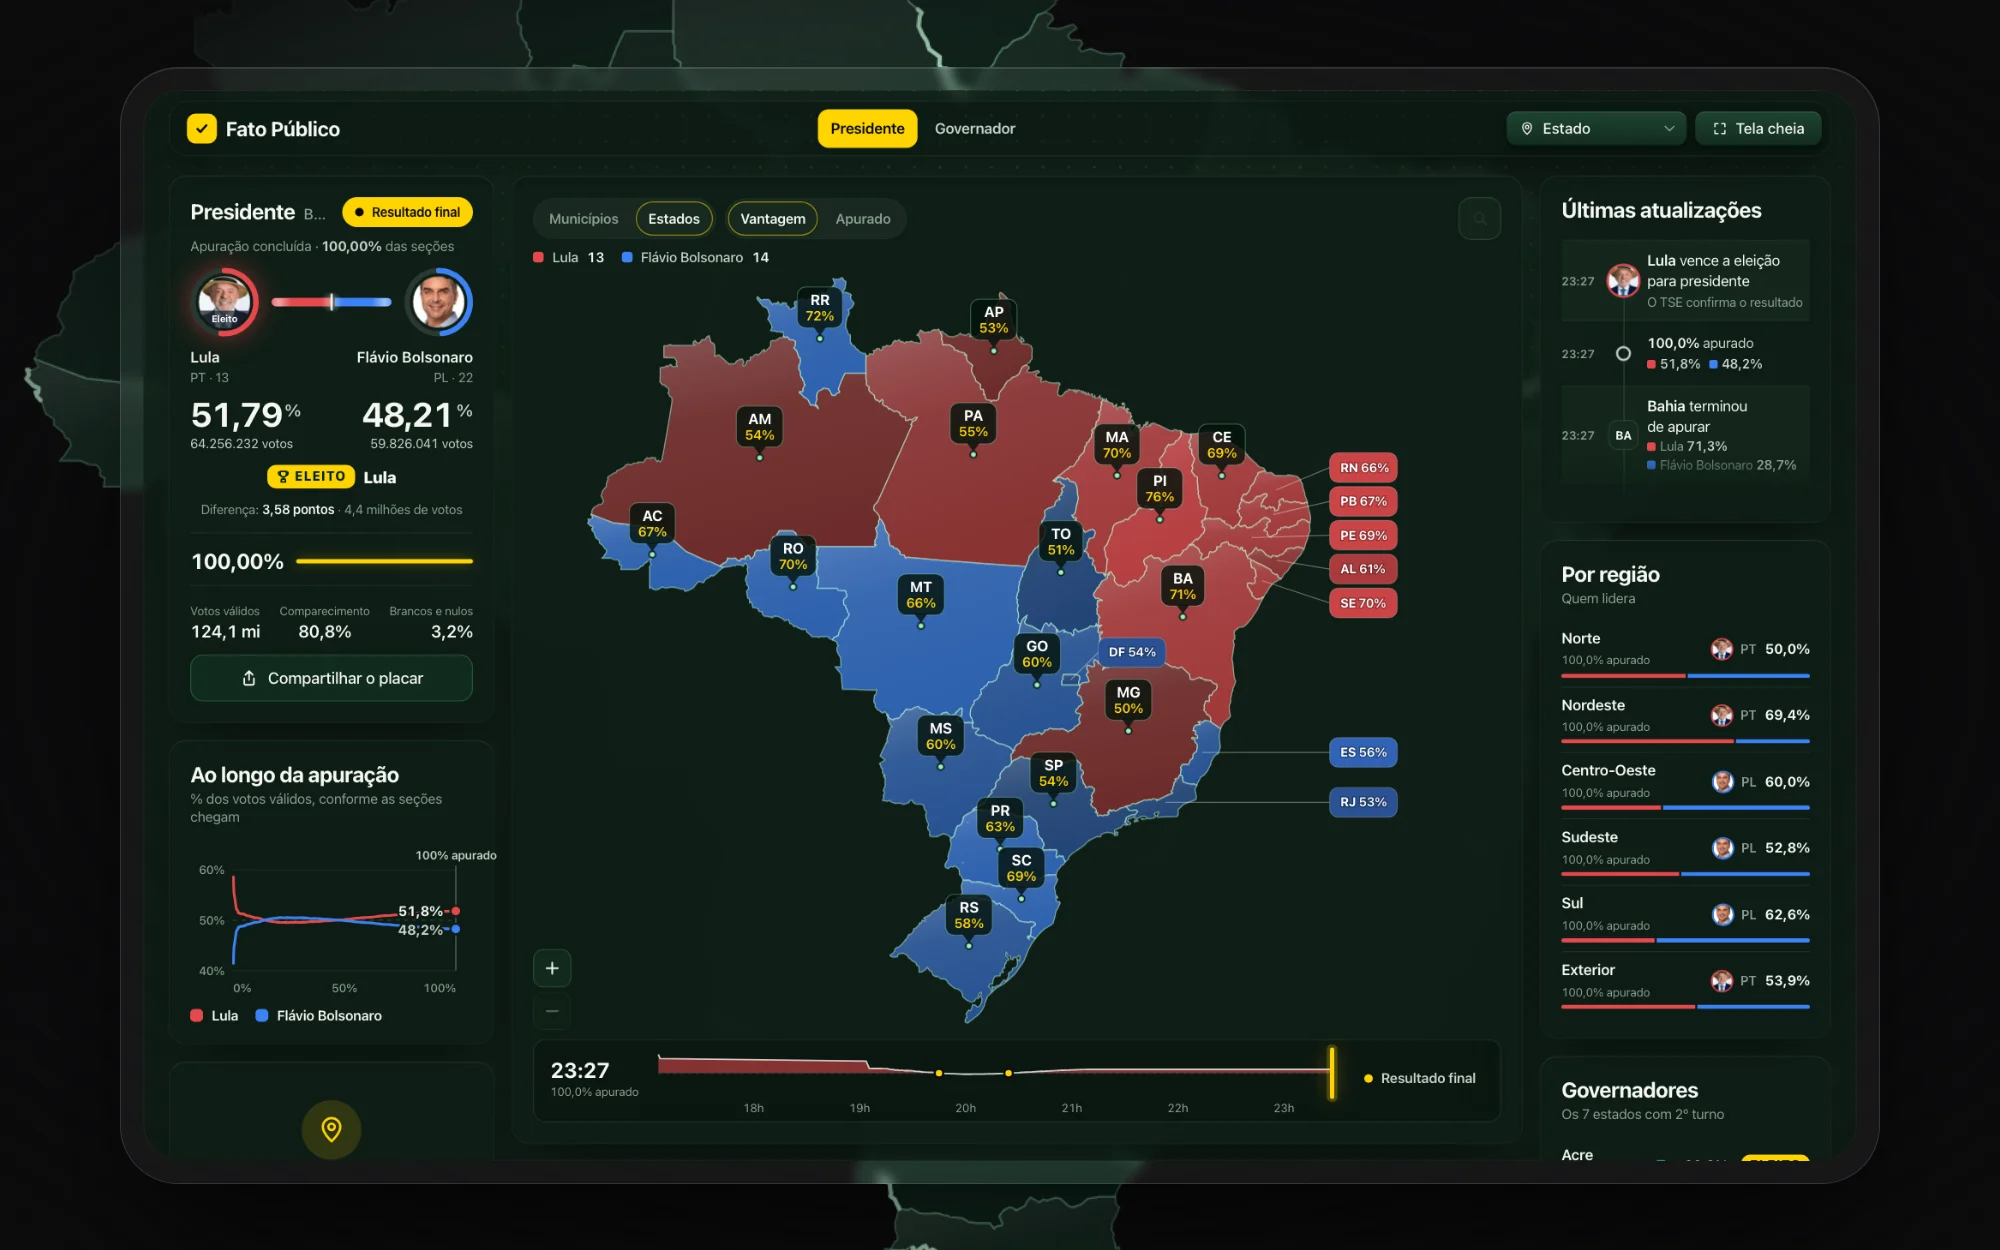
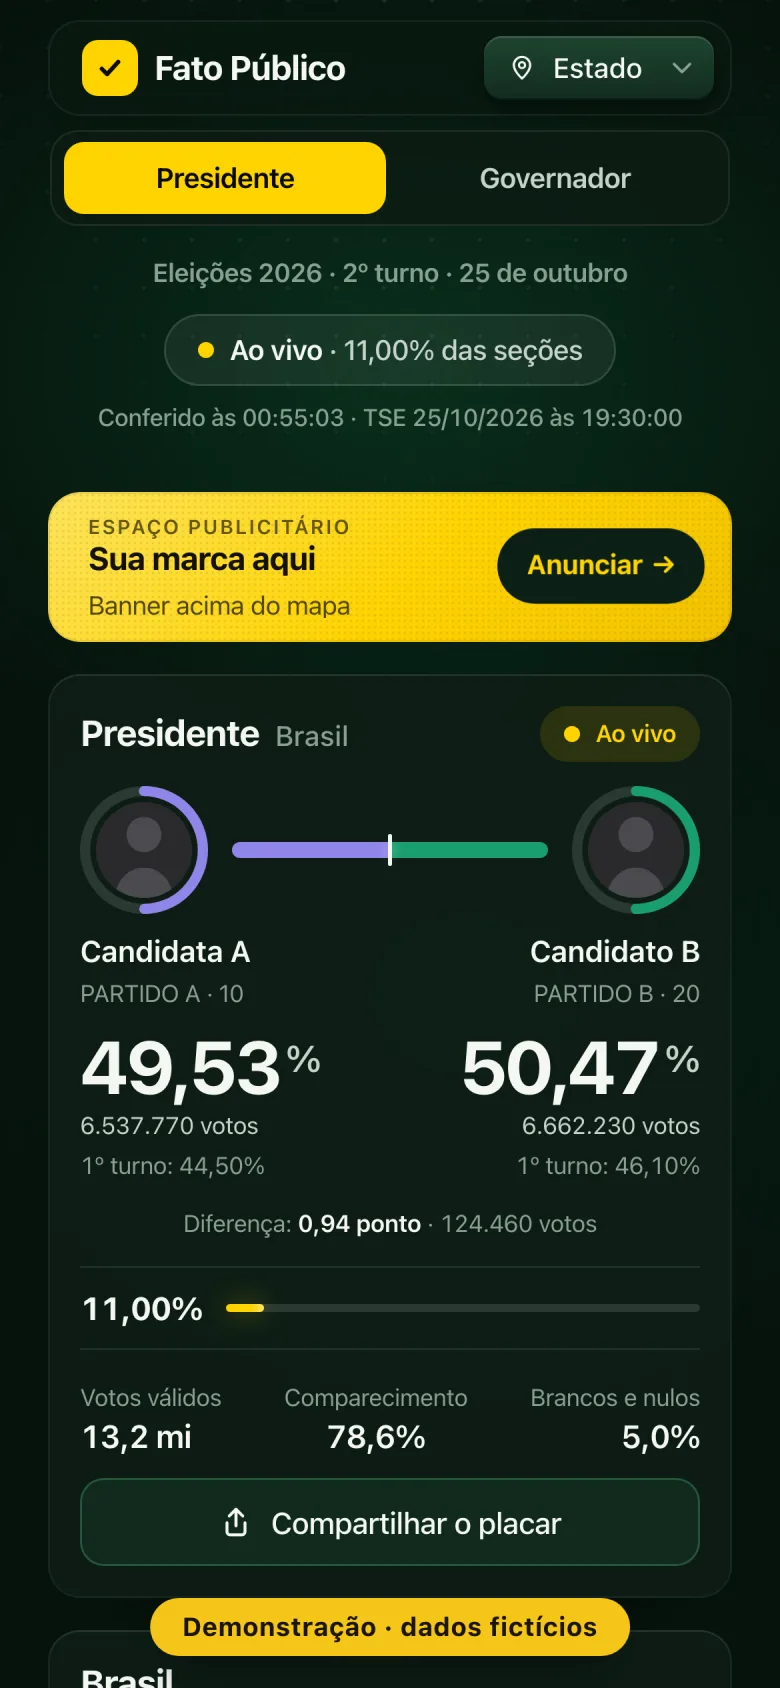
The runoff page brings everything onto one screen: the presidential head-to-head with a bar showing how much has been counted, the state and municipal map with two views (each candidate's lead and how much each place has counted), the bulletin timeline and the TSE updates in order. Every state with a governor's runoff gets its own scoreboard.
Behind it, a custom aggregator reads the TSE's files at the rate its server allows, stores each bulletin and serves everyone from a 10-second cache. If a thousand people open the page at once, the TSE gets a single request.
To show the product before the night without faking results, there's a demo with made-up candidates, where the count runs on its own from the first bulletin to the last. That's what you see in the video below.
Neutrality is a system, not a statement.
Saying "we're nonpartisan" convinces no one. What convinces people is a product that behaves the same for both sides: the same colors for the same parties, names the way voters know them, no highlight color on a candidate's number and no result called early.
The cost: giving up features that would have driven more clicks, like "comeback" alerts and highlighting whoever is ahead. In return, a product people share without worrying that it looks like they've picked a side.
Selling ads without talking to anyone
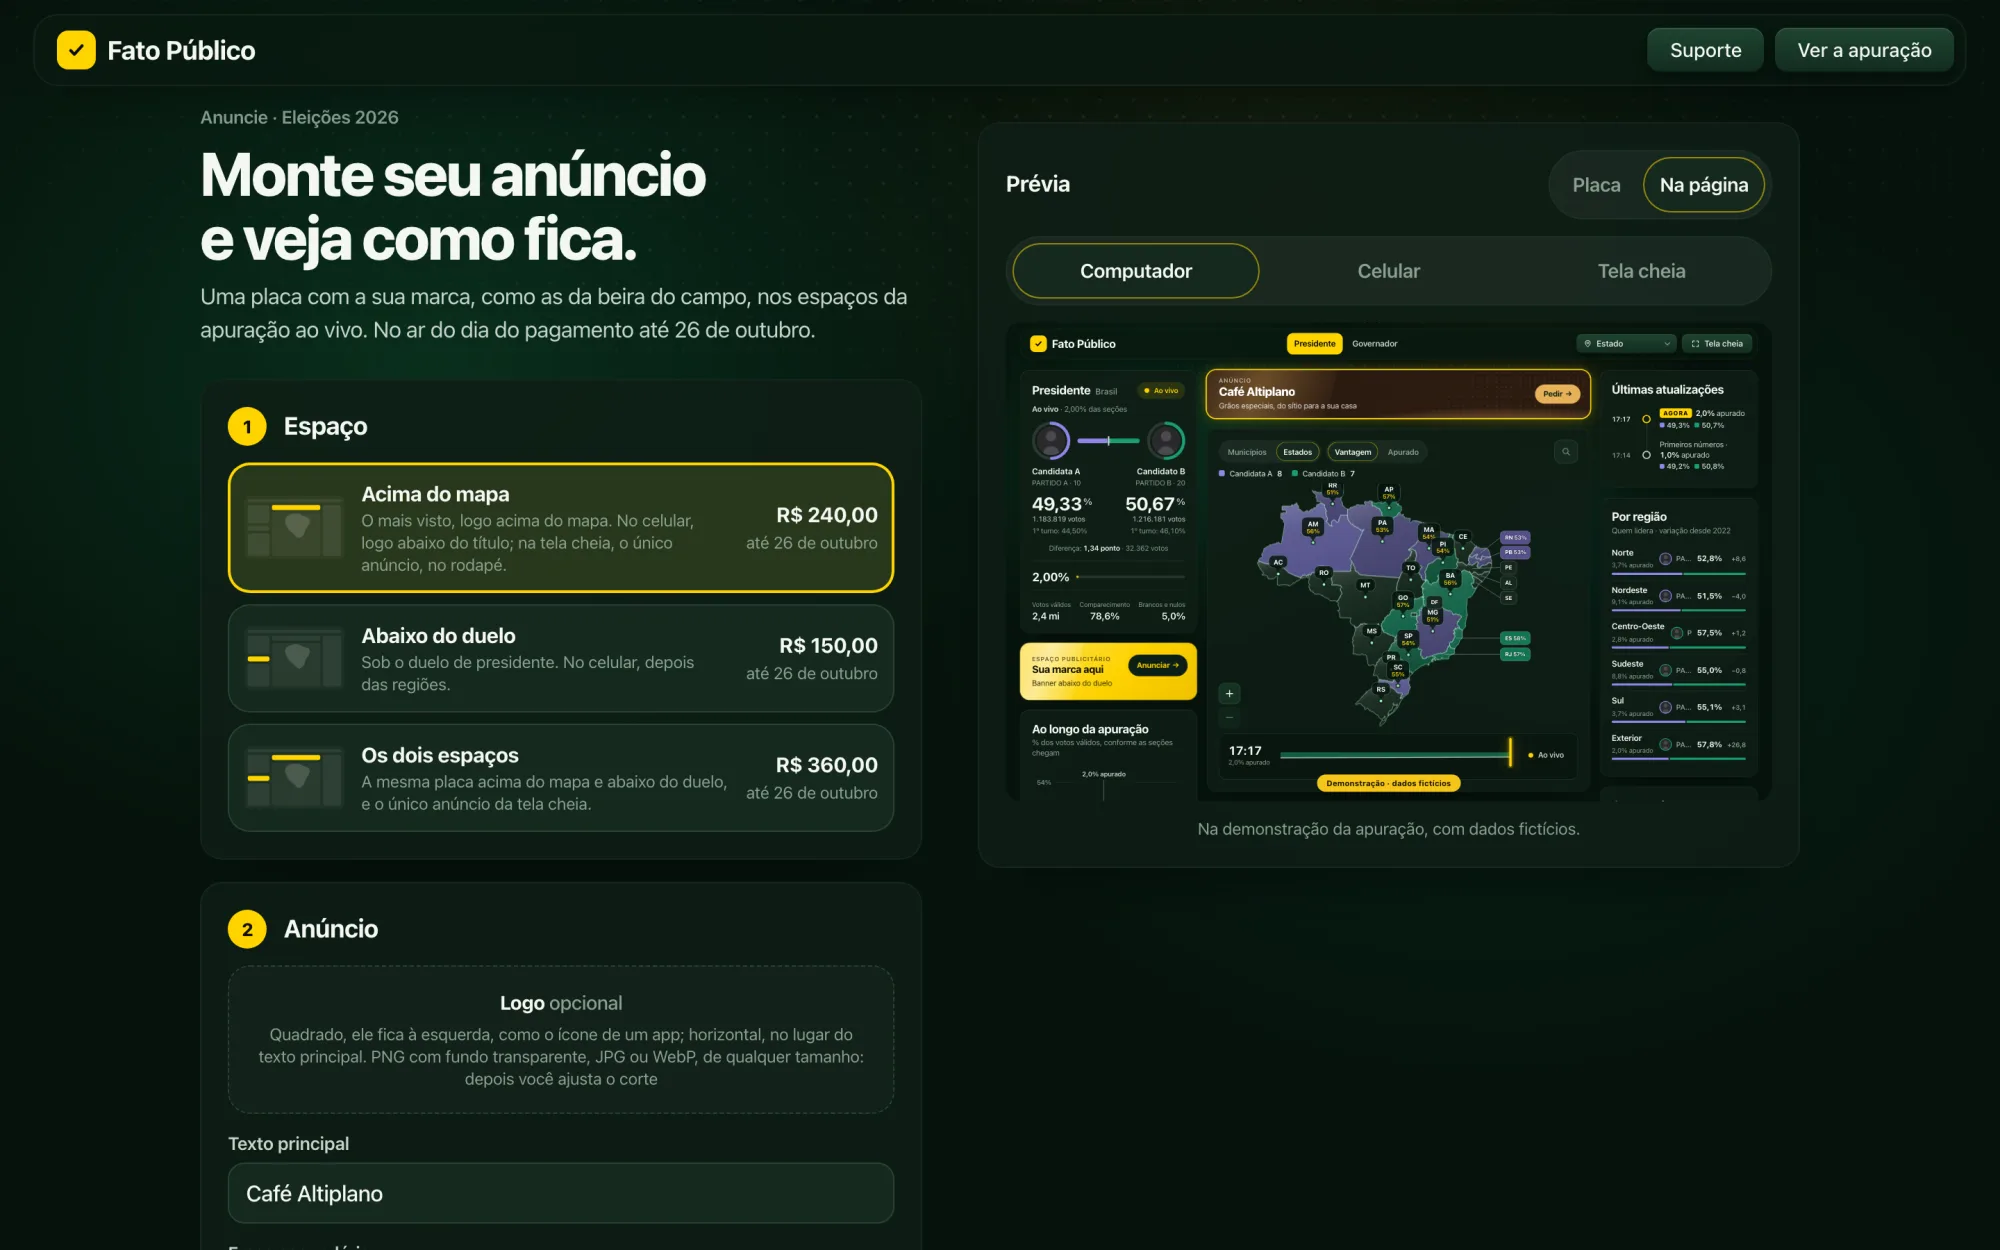
The ad slots on the results page sell themselves, on a single page (/anunciar), designed so a small-business owner can do everything from a phone:
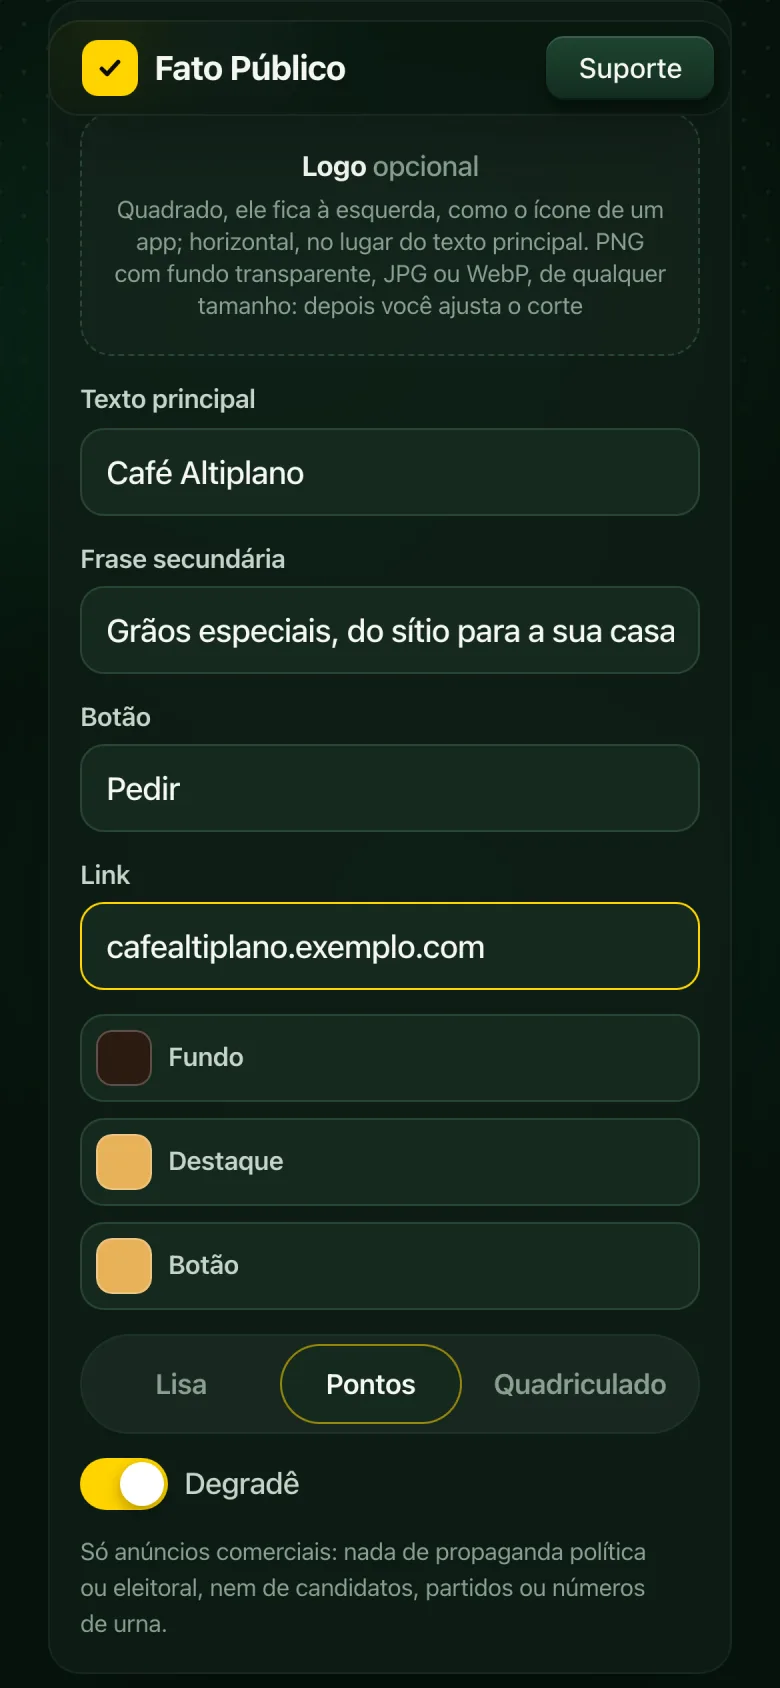
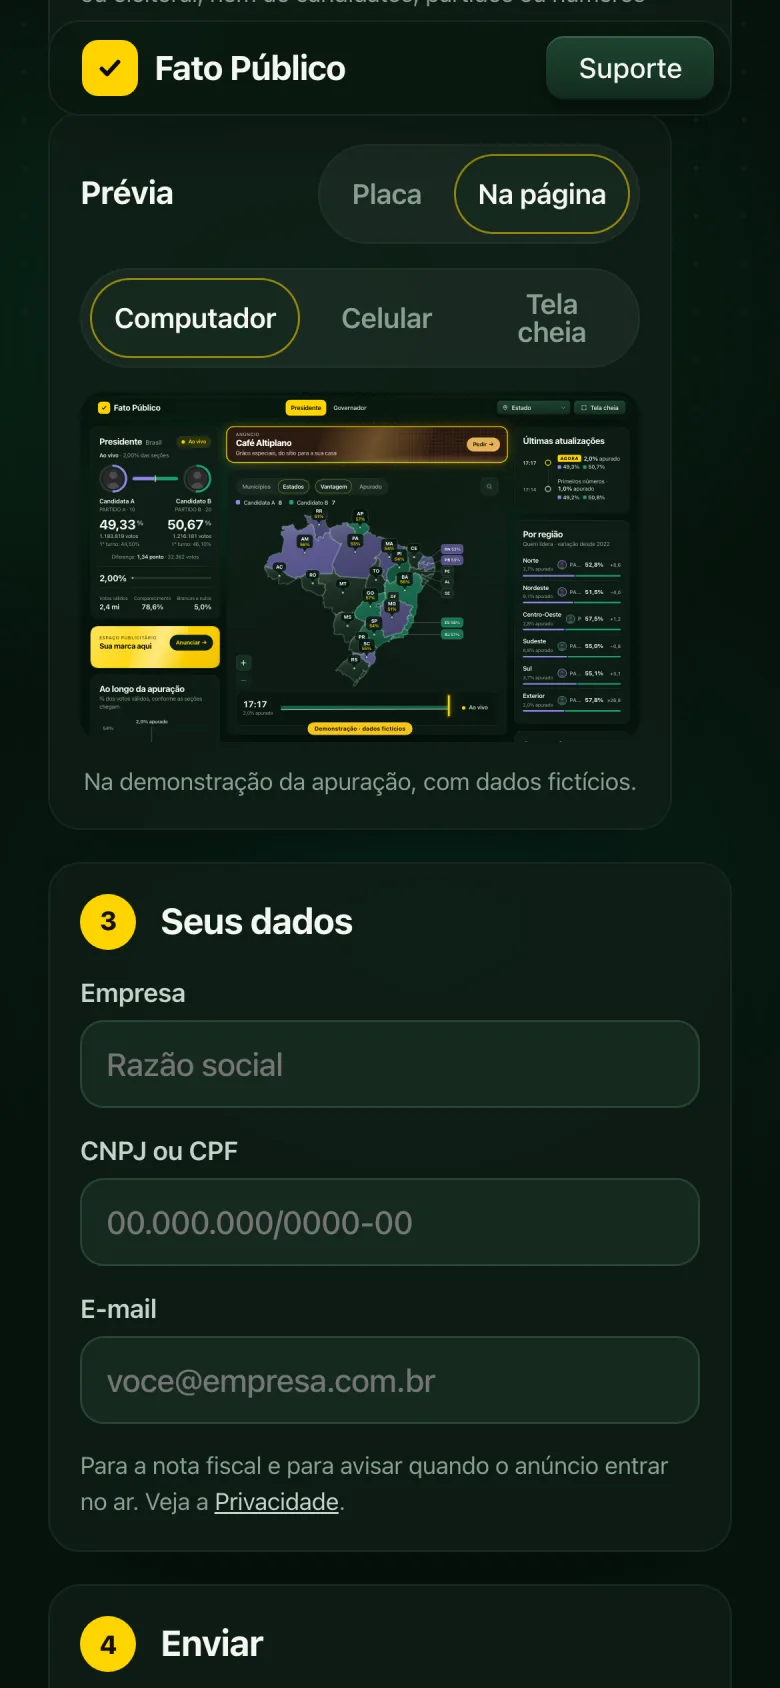
- Build the board. Pick the slot, write the brand name, tagline and button, upload the logo and pick the colors. The preview updates with every keystroke, styled like the LED boards along the sidelines of a soccer field.
- See it on the page. The board shows up inside the real results page, on desktop, mobile and full screen, before you pay.
- Automatic review. On submission, an AI checks the ad against the advertising policy (nothing political or electoral). If it's approved, the Pix code (Brazil's instant payment system) appears right away; if the AI is unsure, the request comes to me.
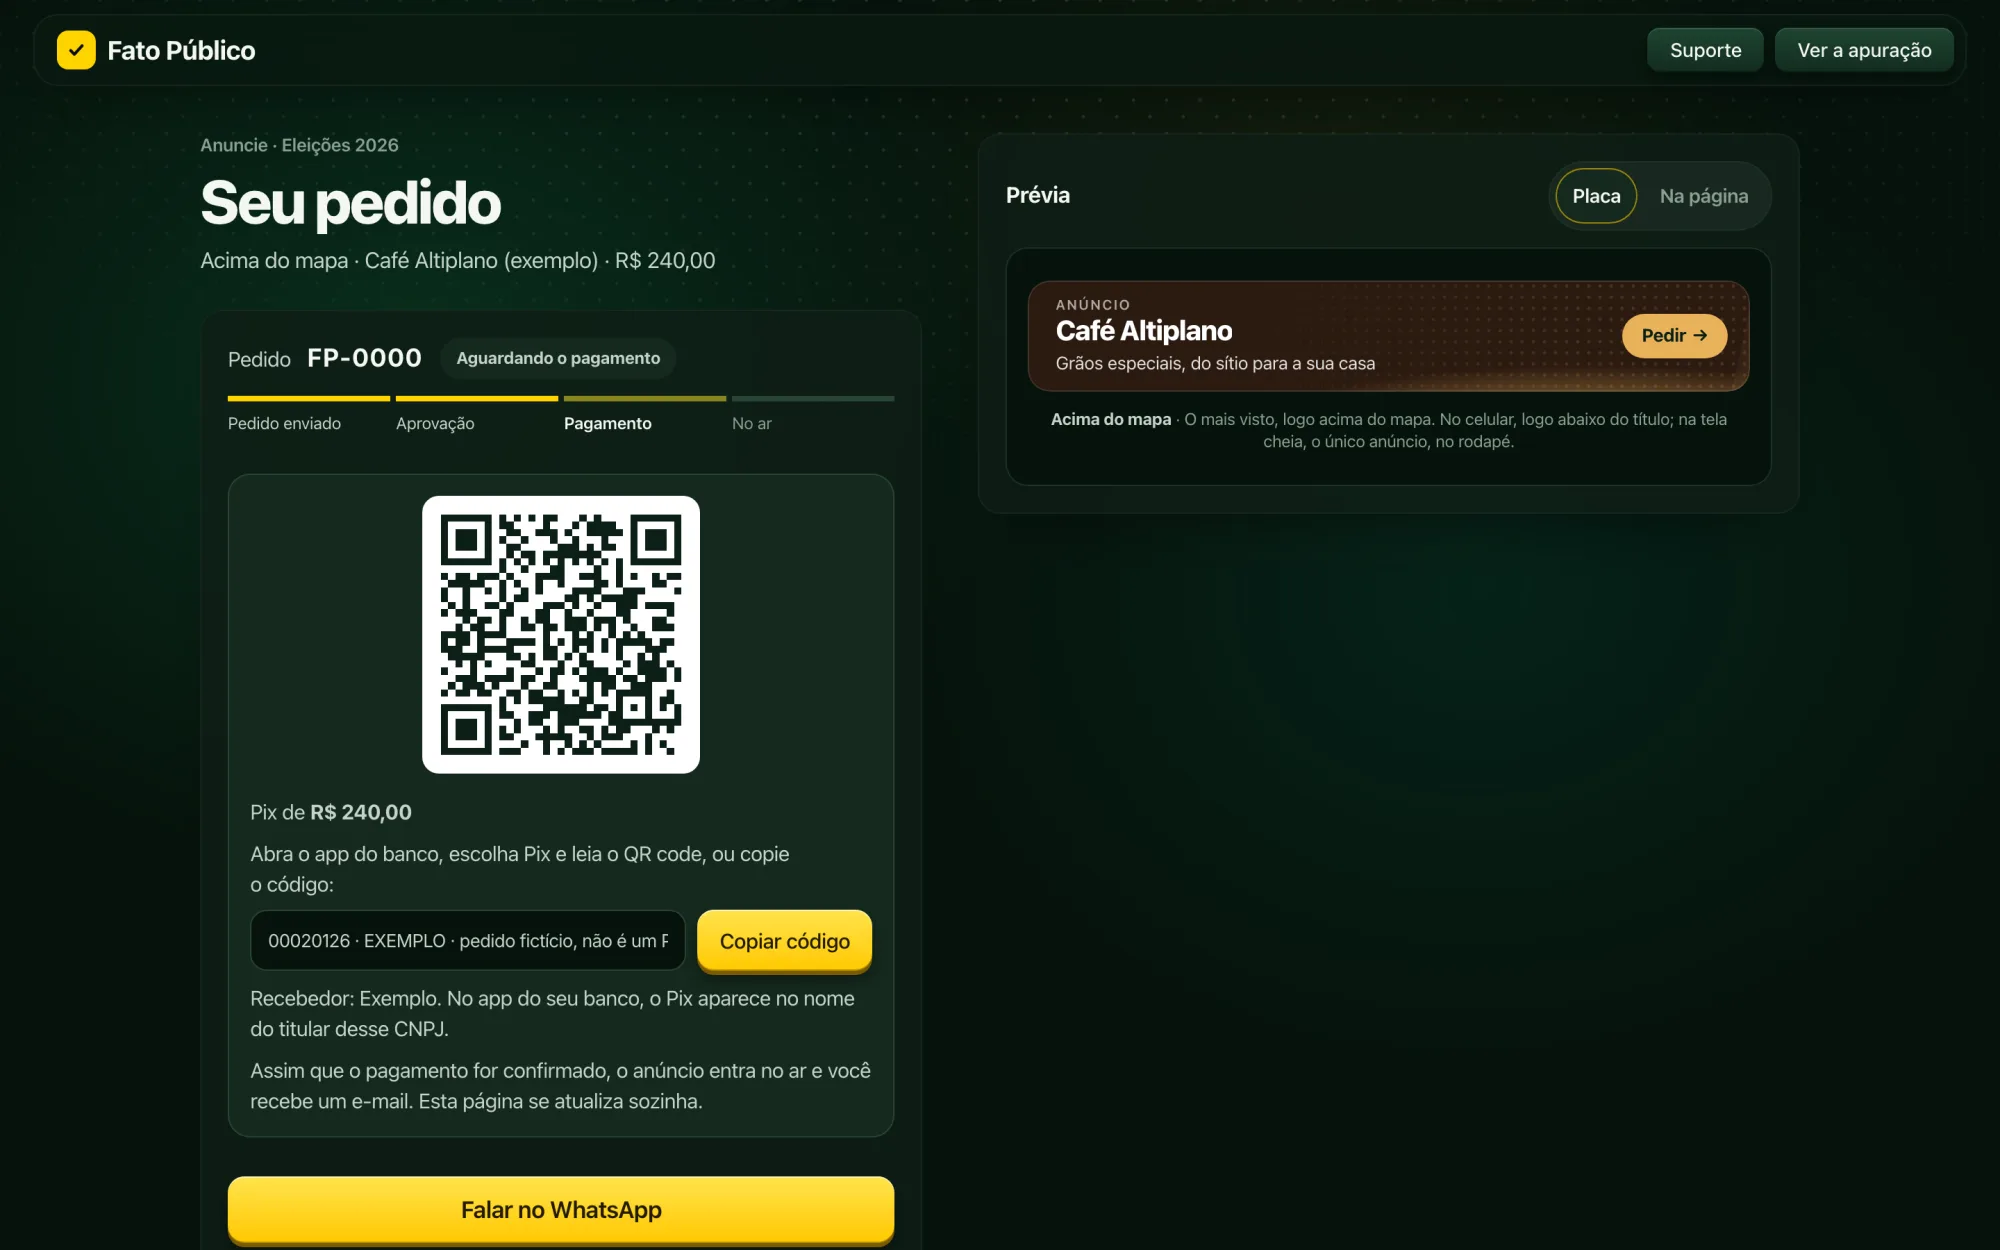
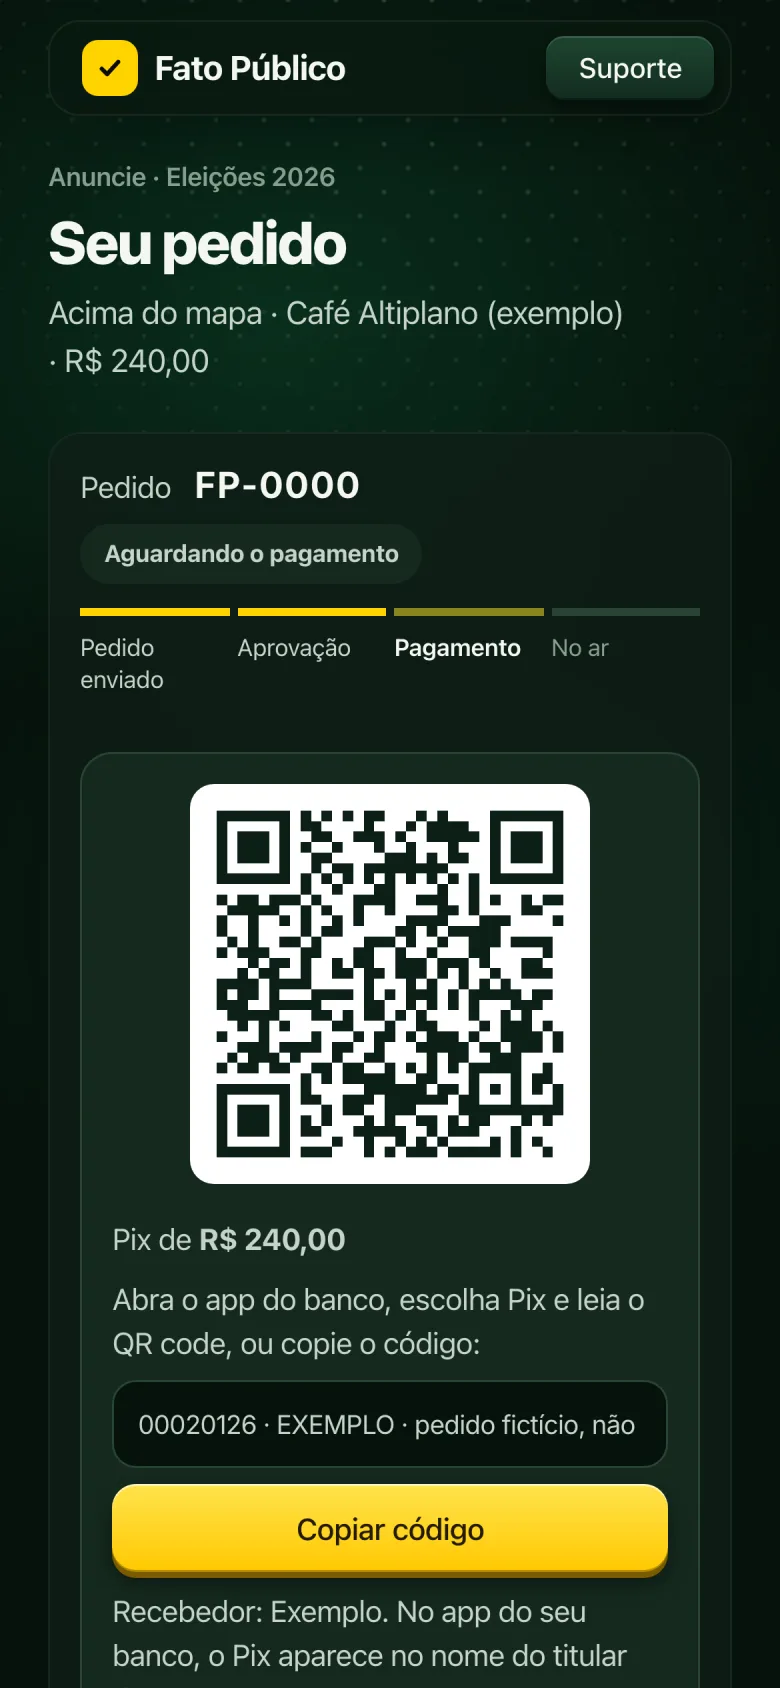
- Pay and track. Direct Pix payment, no middleman, and an order page that updates itself until the ad goes live.
Pricing follows the audience: a floor price plus one week of traffic at a CPM rate, capped, and it never drops in a slow week.
1 · Build the board · the preview updates with every keystroke
The dashboard
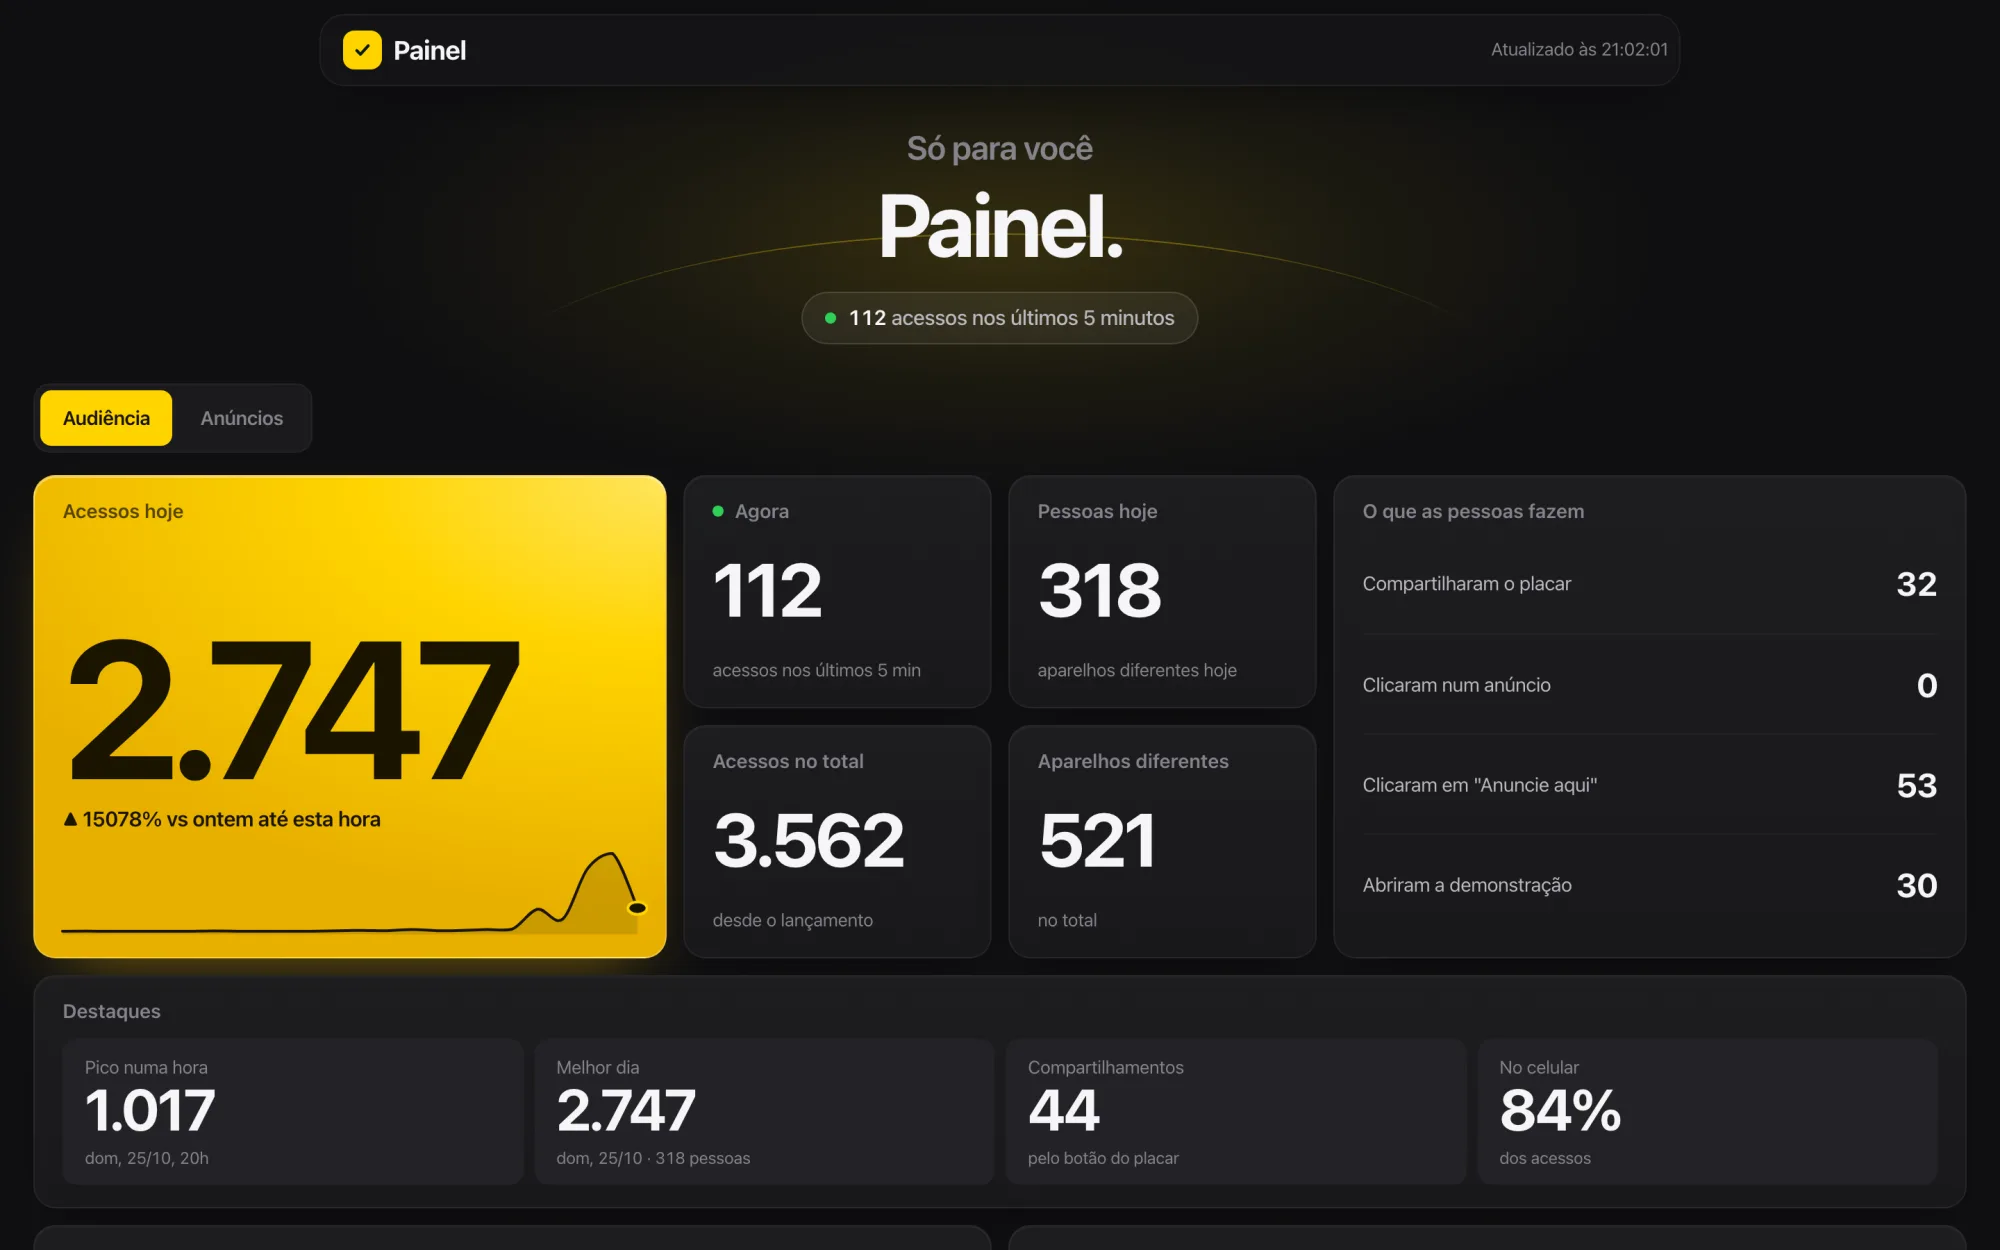
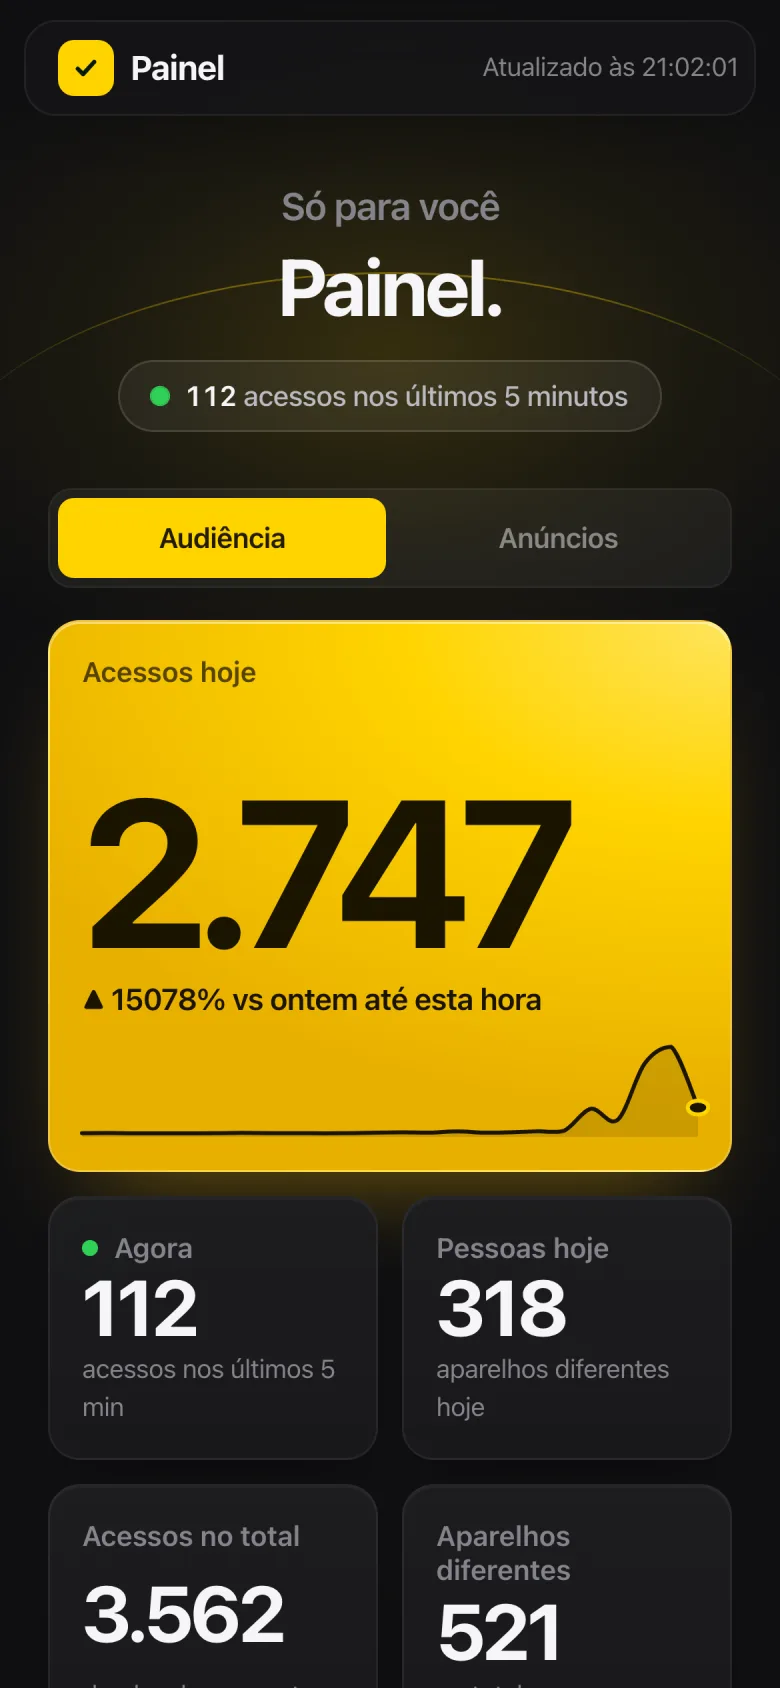
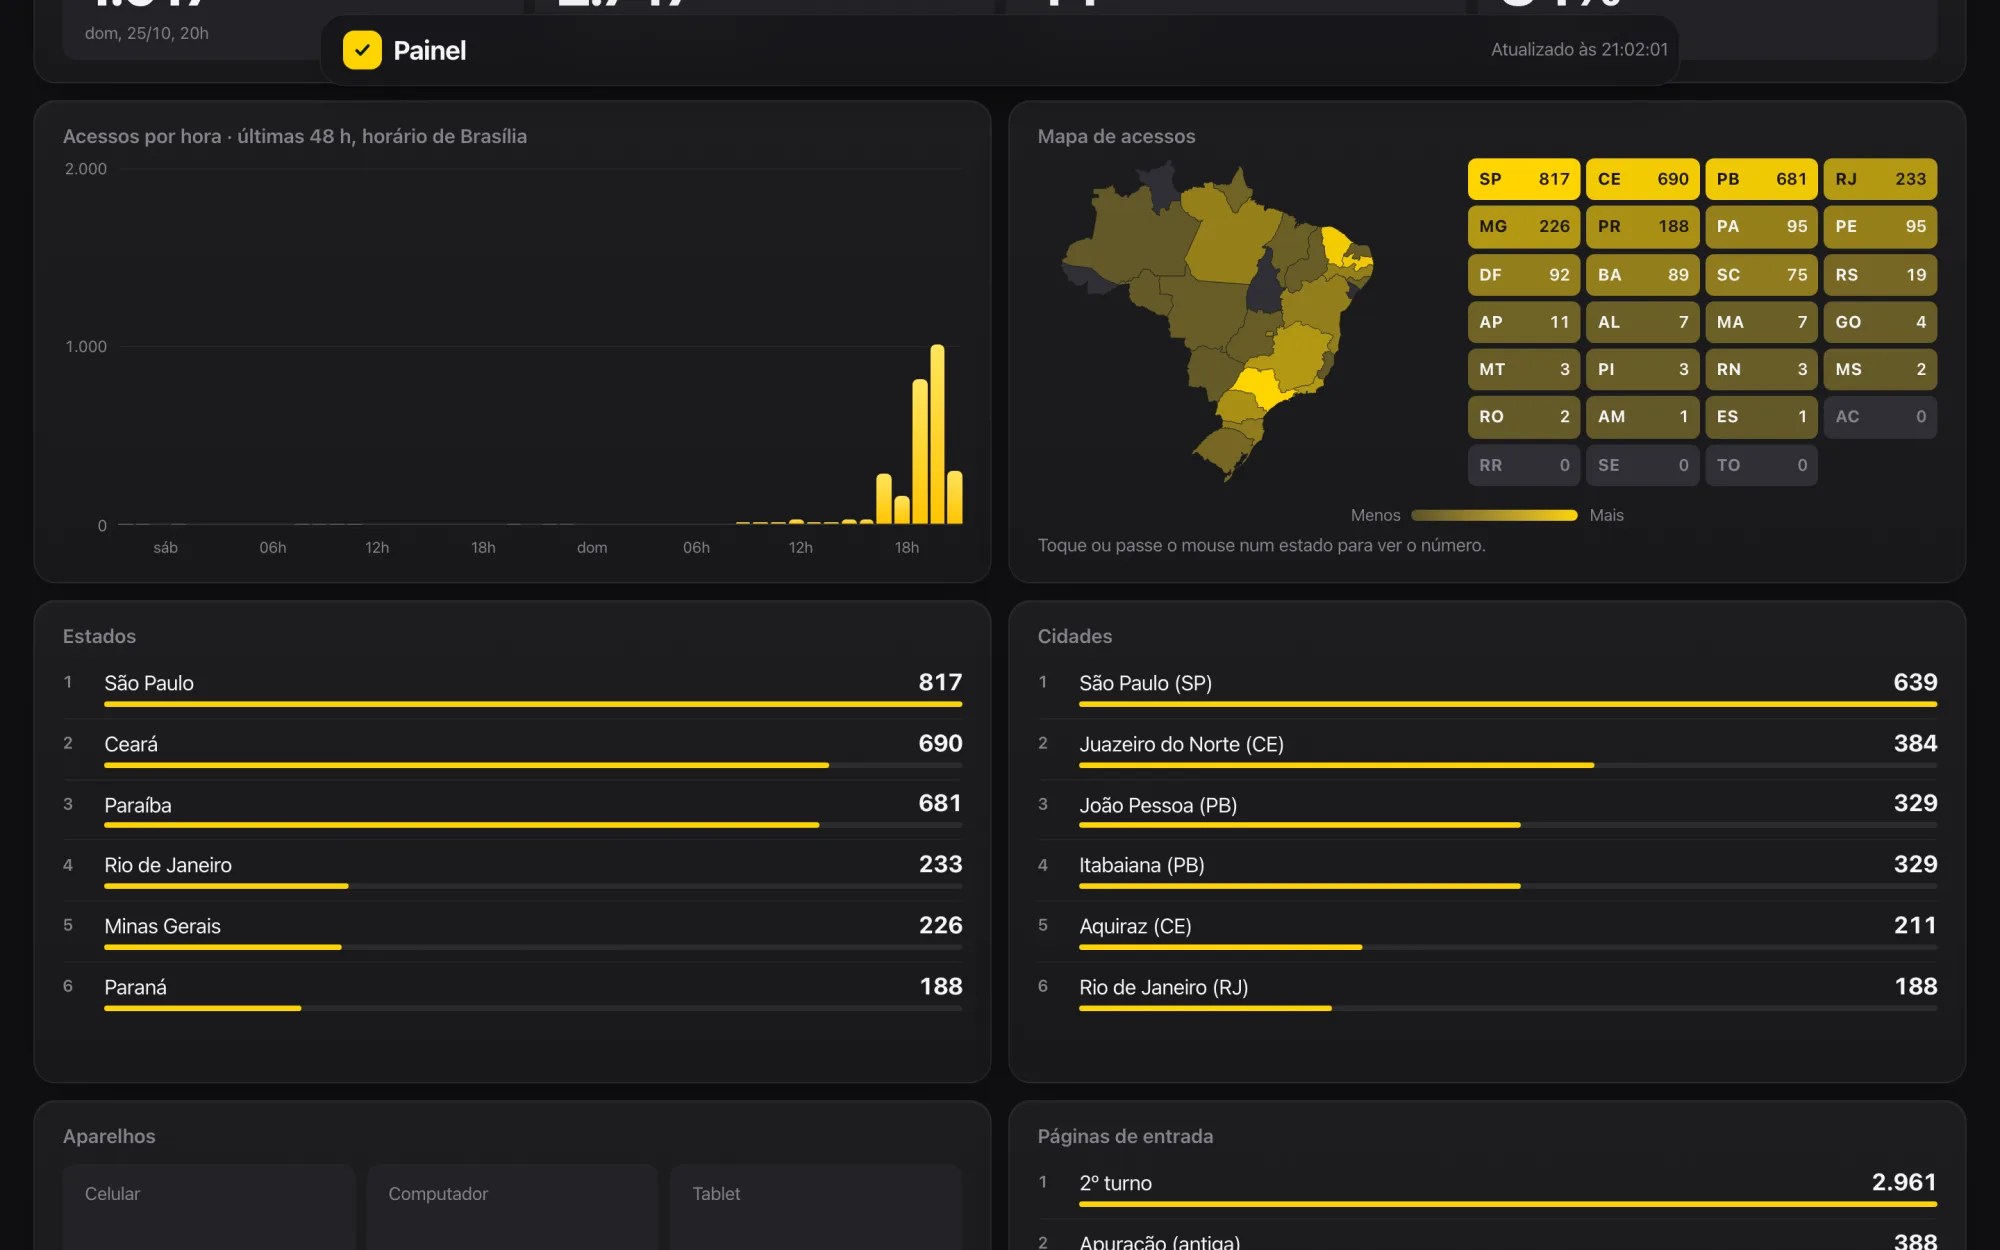
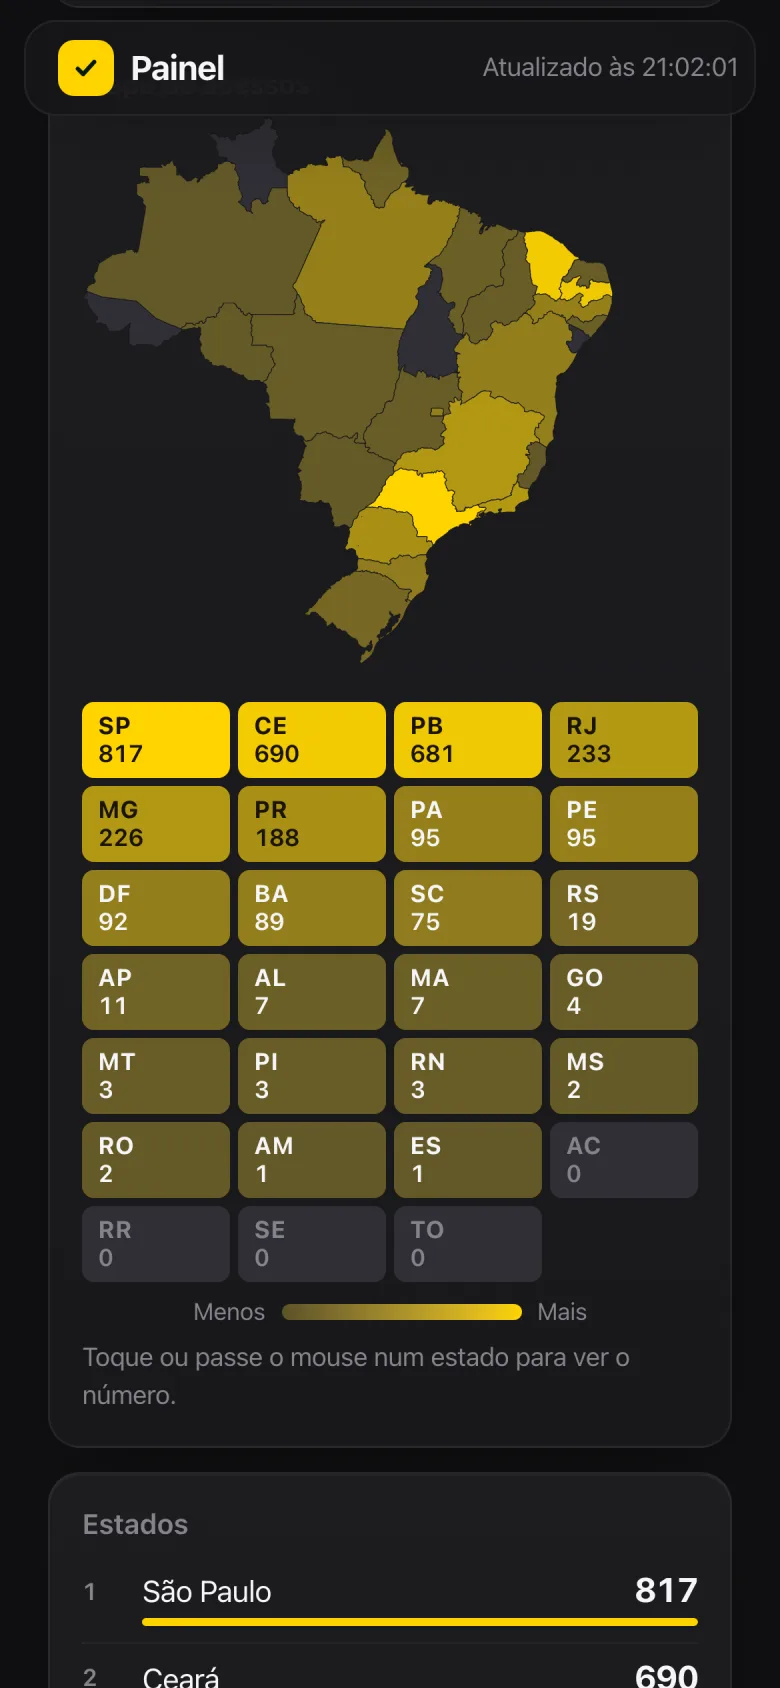
Behind the site, a private dashboard tracks the night in real time: how many people in the last 5 minutes, today versus yesterday at the same hour, the hourly curve, the map by state, cities, devices, landing pages and what people do (share the scoreboard, click an ad, ask to advertise).
The other tab manages ads: approve or reject a request, mark a Pix payment as received, take an ad down and adjust prices. The same actions arrive by email, with signed buttons, so I can handle them from my phone. That tab is left out of the screenshots because it shows companies and contact details.
The count uses no cookies and stores no IPs. My own devices aren't counted.
Audience · as it stood at 9:02 p.m. on Oct 25, near the peak
The site's numbers
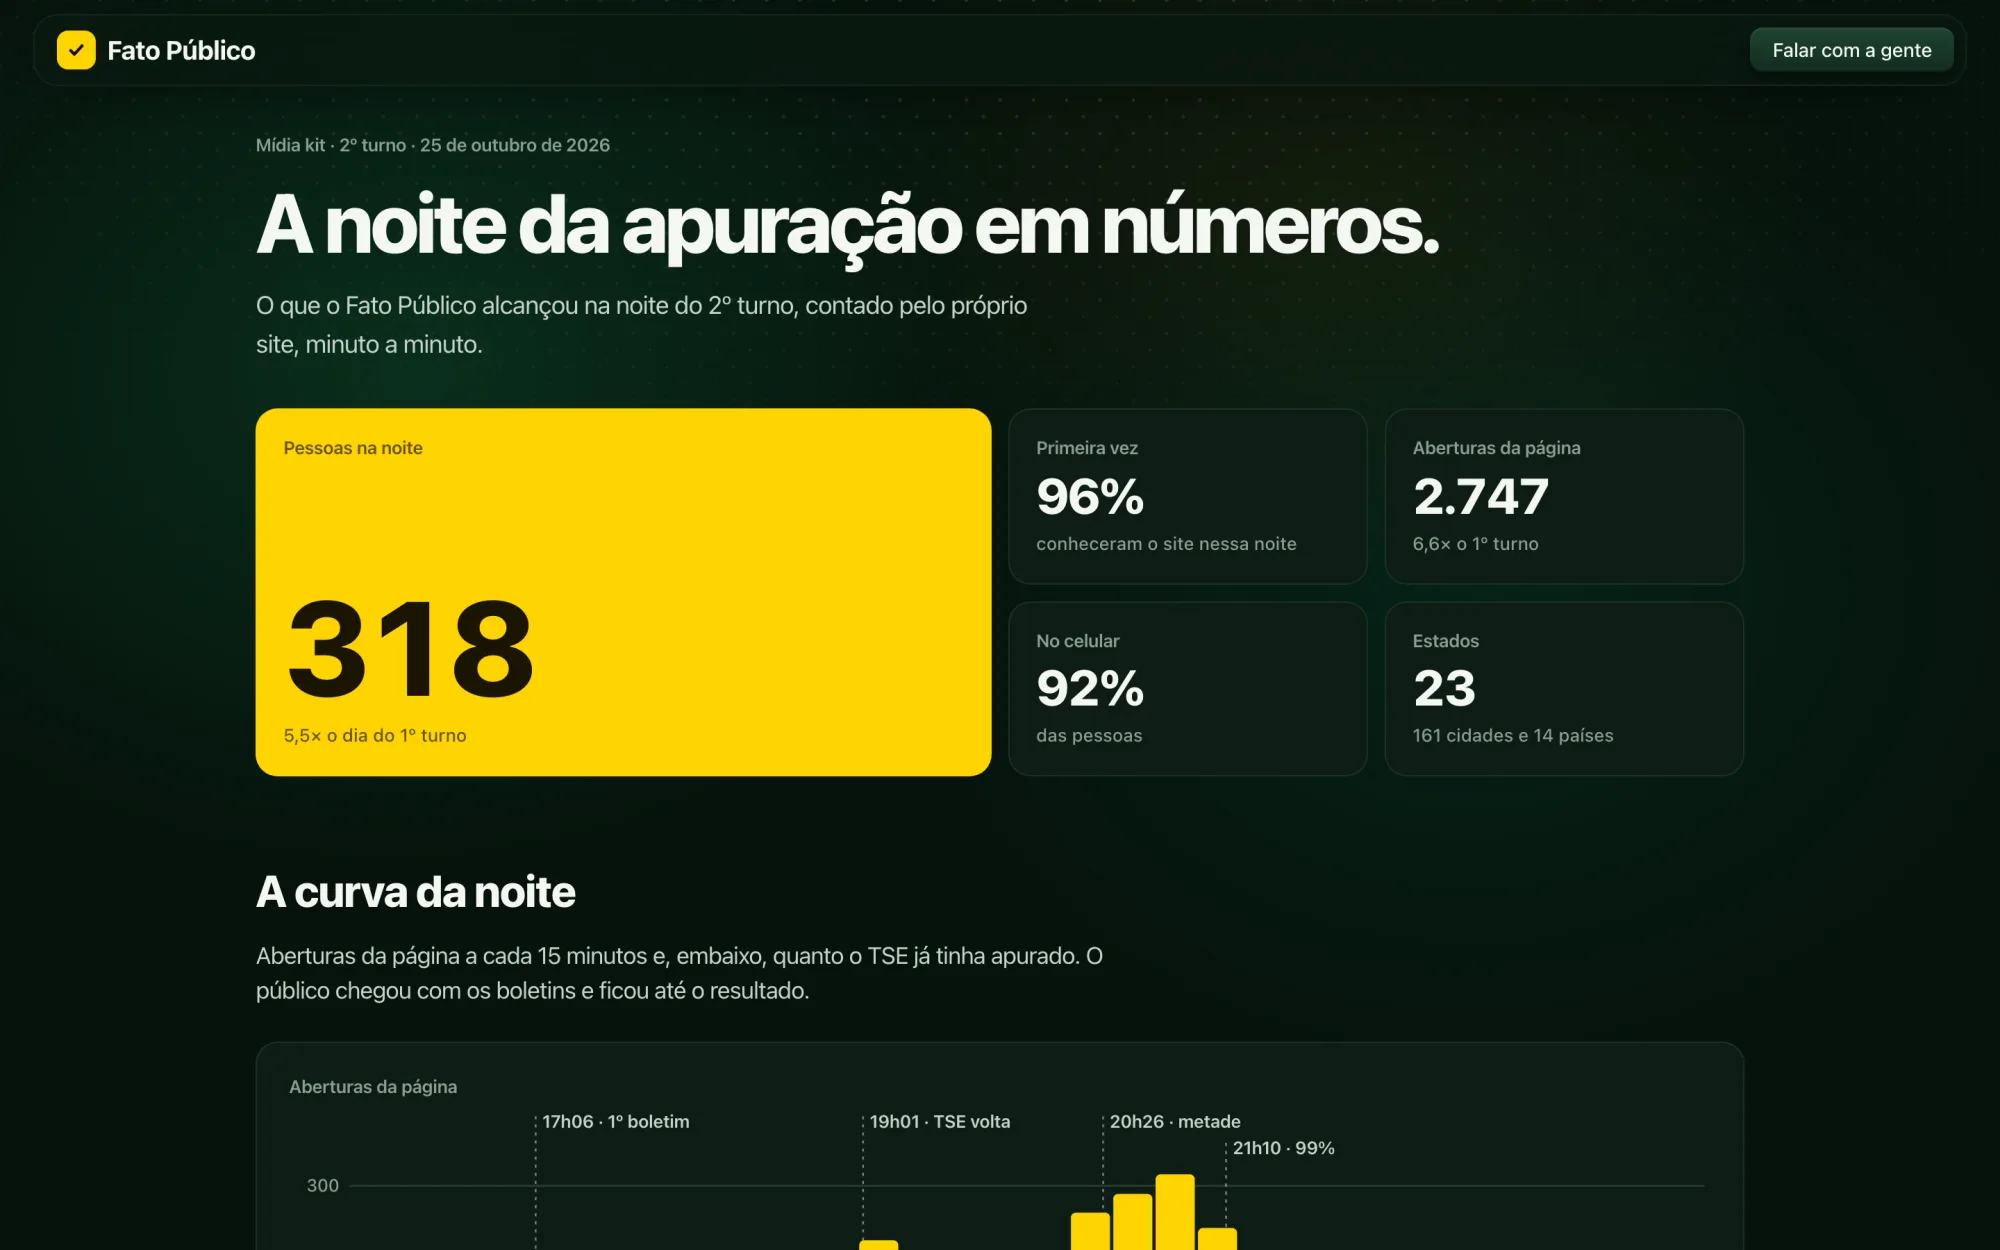
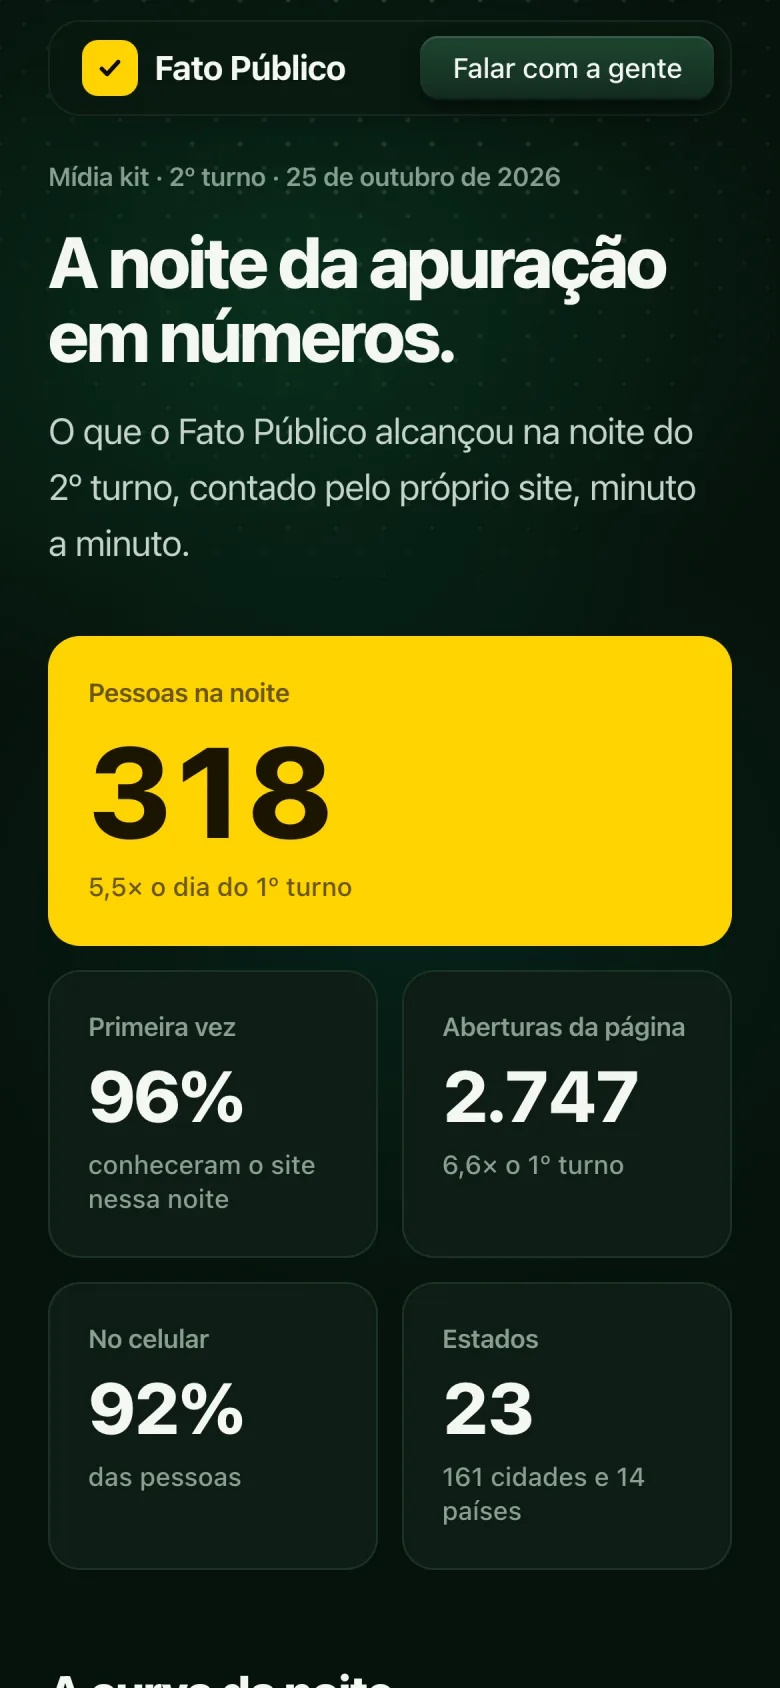
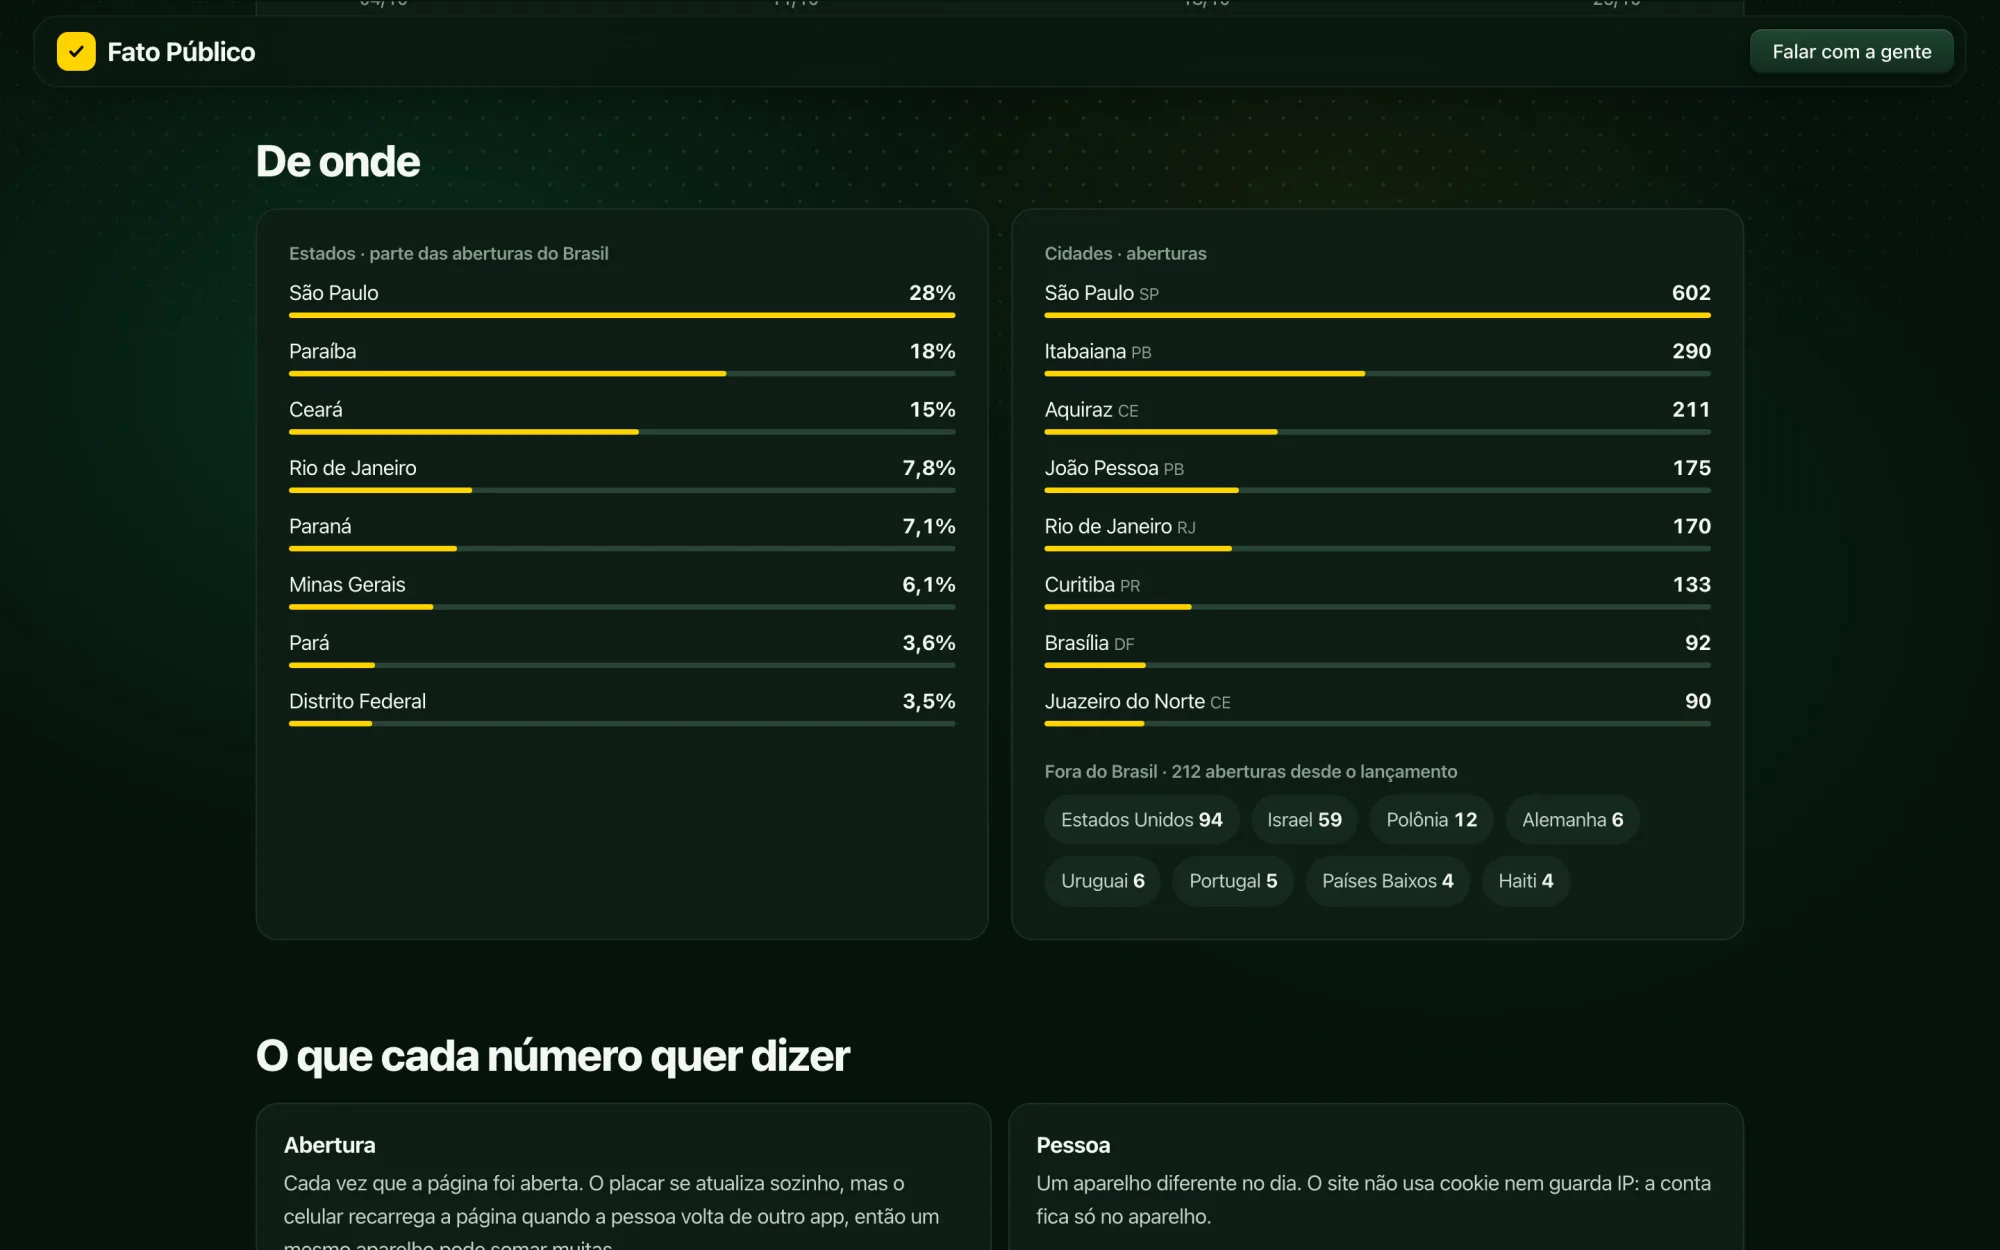
Cookie-free counting was enough to understand the night minute by minute and to build a public media kit, with real numbers, for anyone who wants to advertise on the portal.
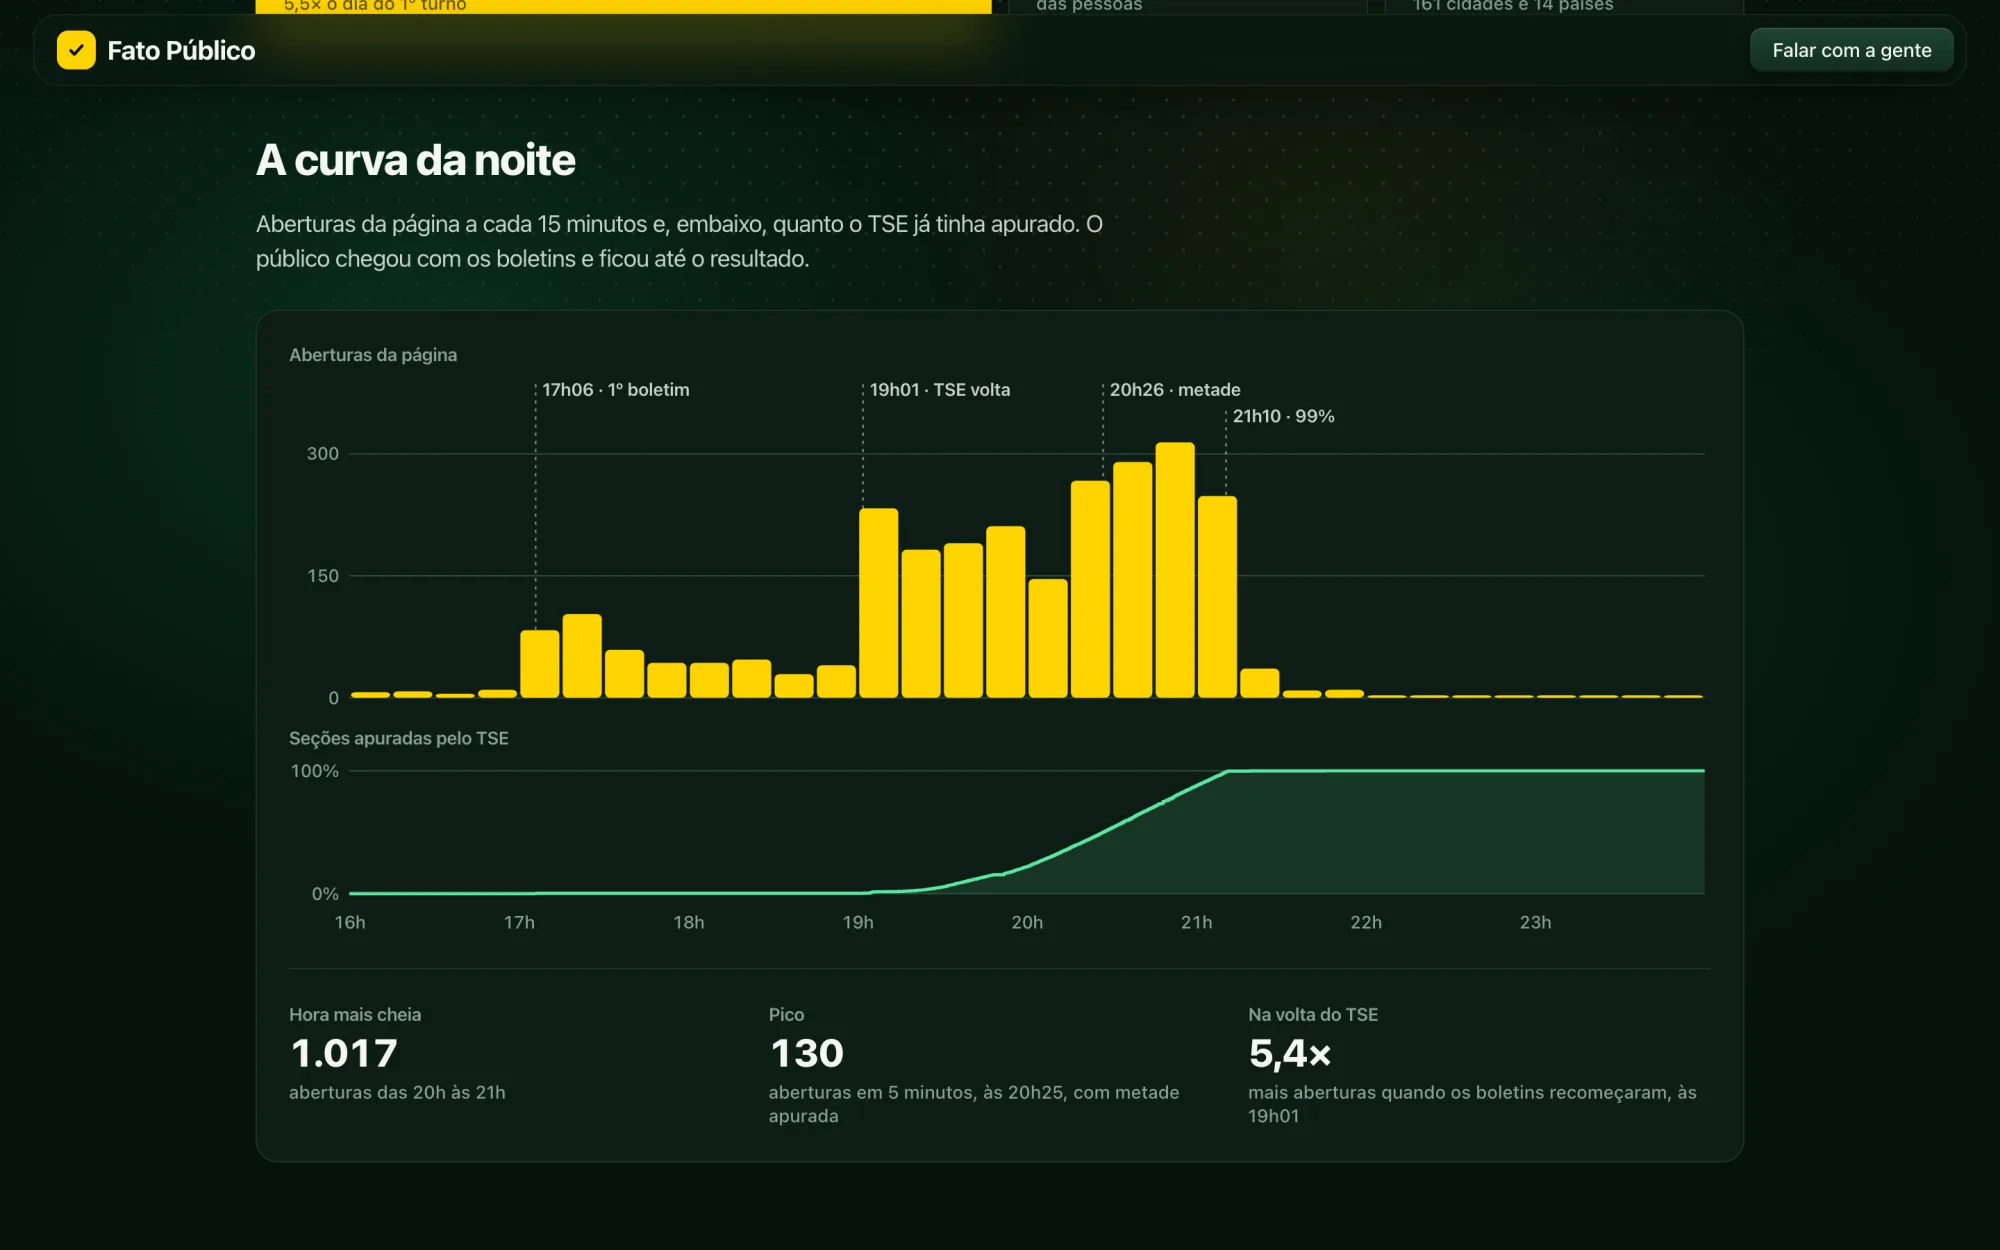
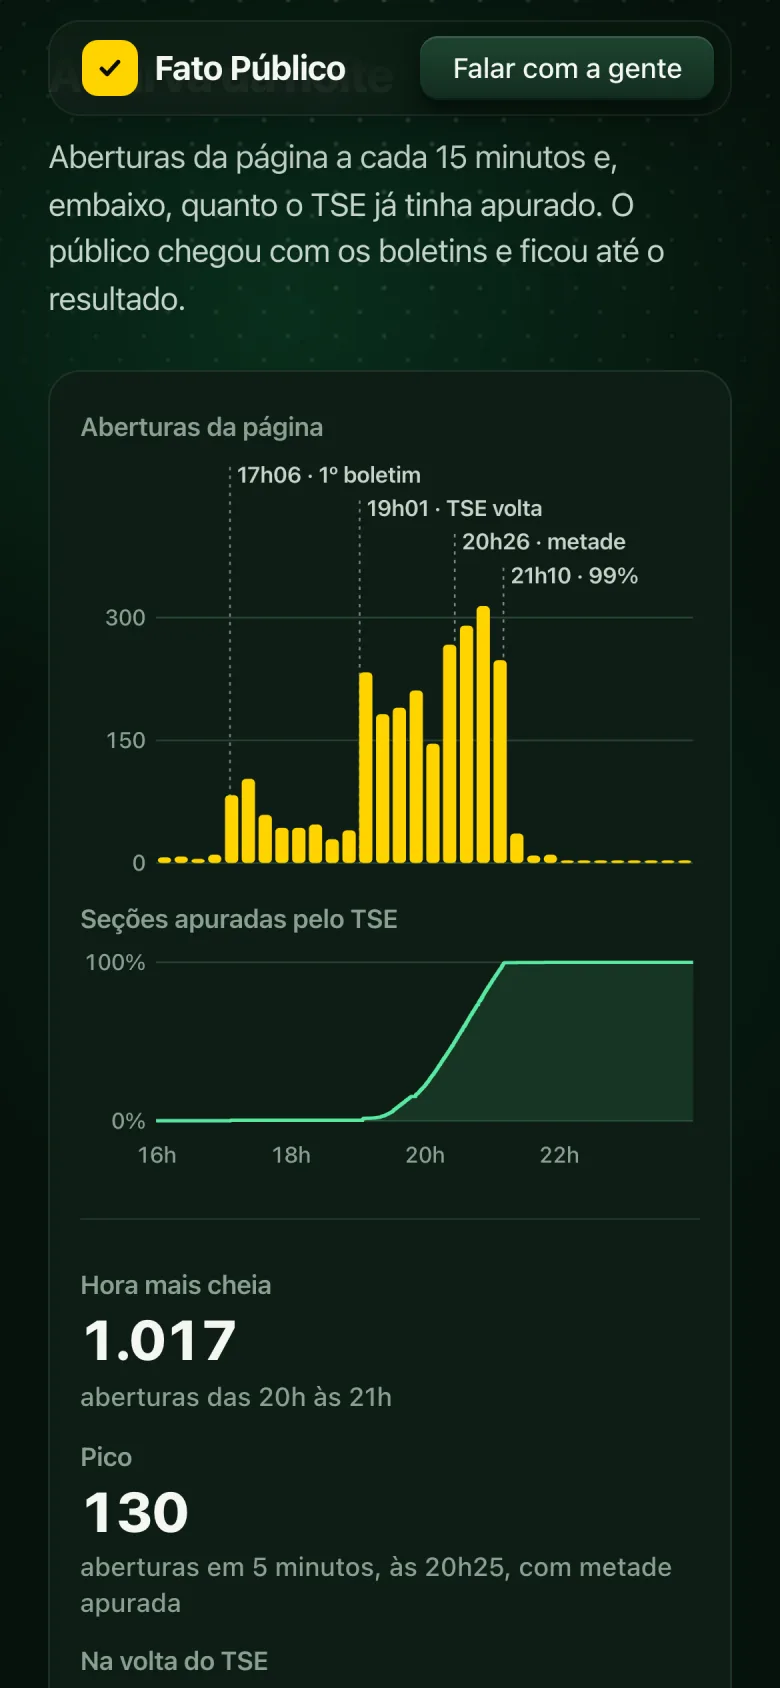
The clearest finding: the audience followed the TSE. The TSE released its first bulletin at 5:06 p.m. and then went silent until 7:01 p.m. The audience dropped with it and came back 5.4 times larger when the bulletins resumed. The peak came at 8:25 p.m., with half the ballot boxes counted. At 99% counted, the audience went to bed.
The number that matters most isn't page views (the same phone reloads the page every time someone comes back from another app), it's people: 318 that night, 96% of them for the first time.
Media kit · 318 people that night, 5.5× the first round
On Instagram
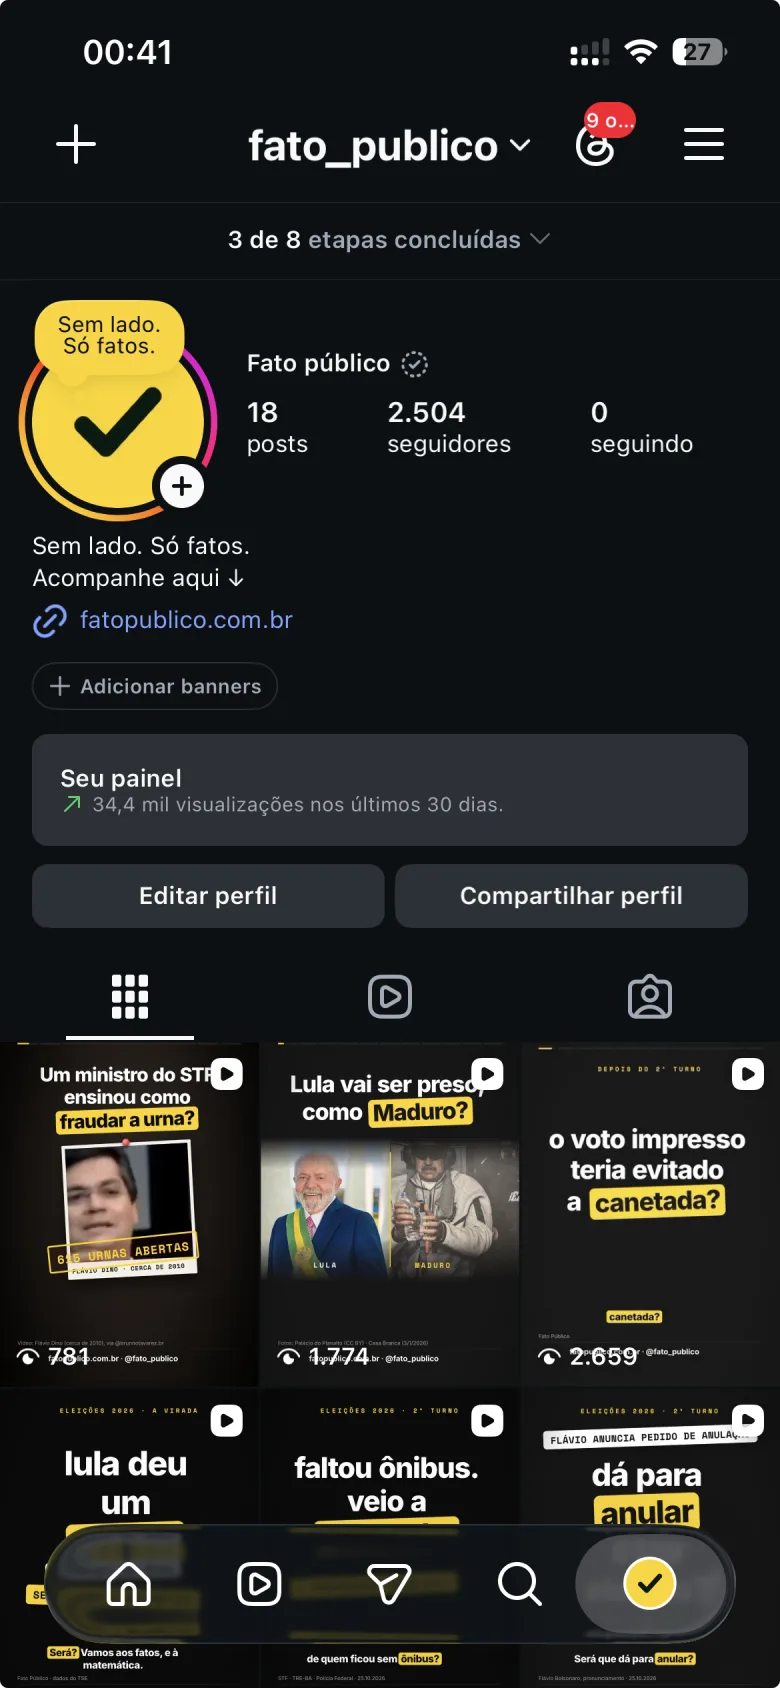
@fato_publico brings the same approach to the feed: short Reels with the official numbers, rumor fact-checks and questions anyone might ask, always with the source on screen. I built a custom visual kit (black background, sentences marked with a yellow highlighter, mono labels, fact-check cards) and a grid that maps Instagram's safe zones, so no text ends up under the buttons.
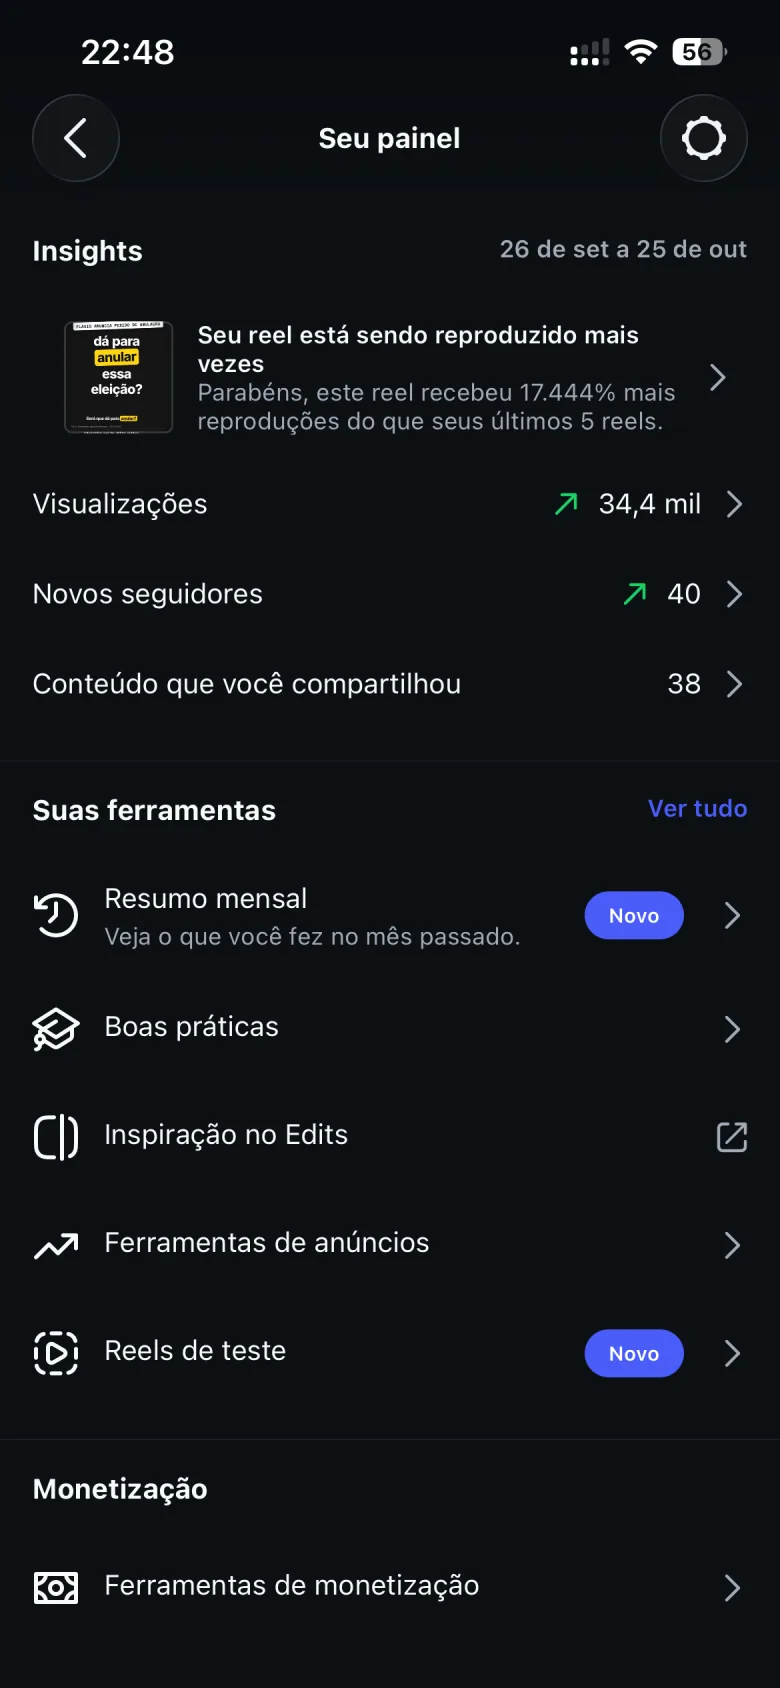
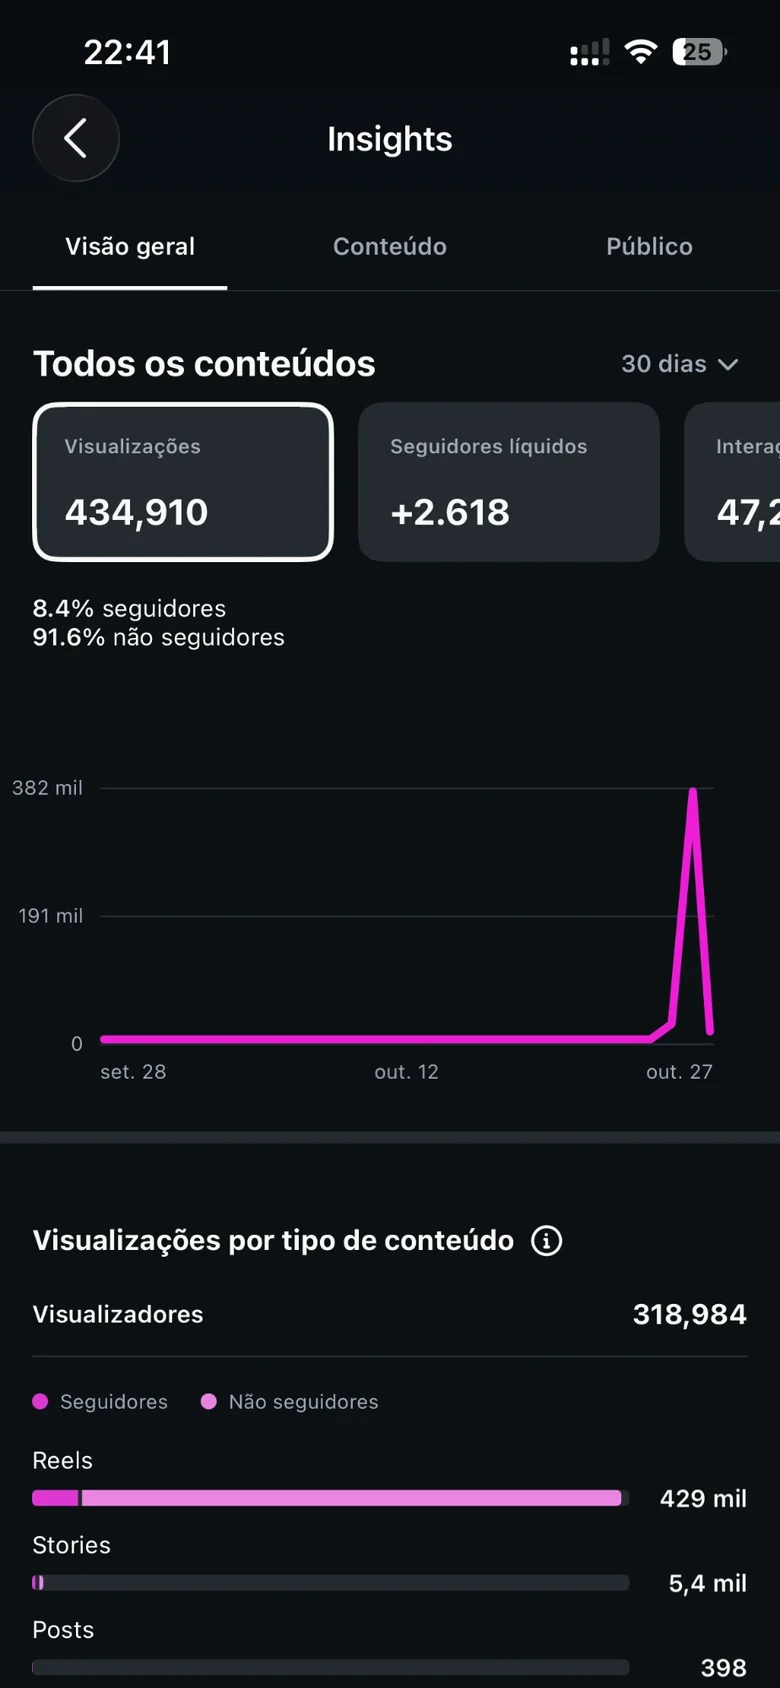
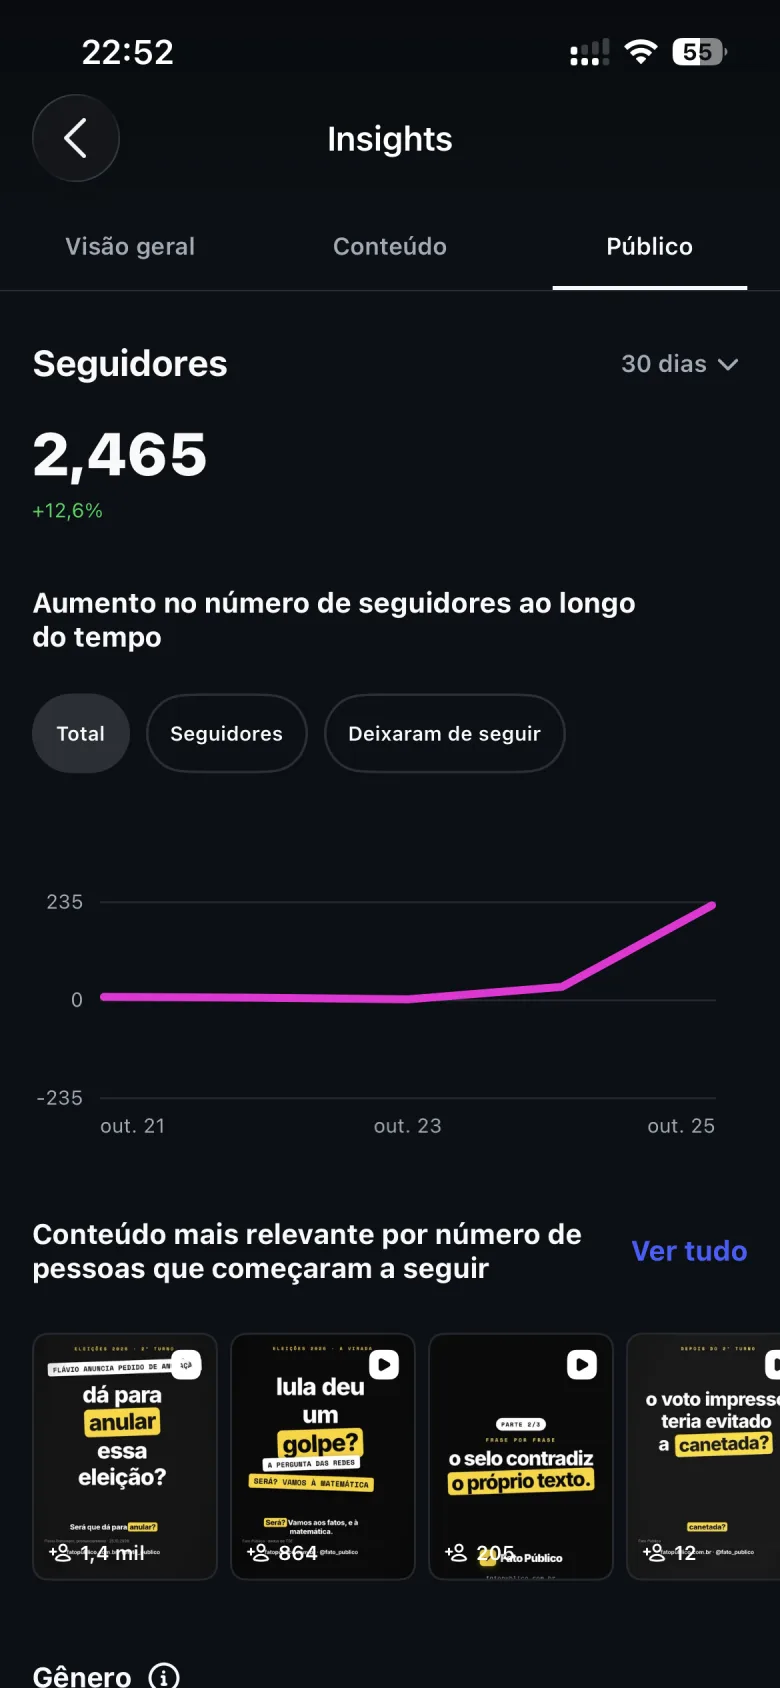
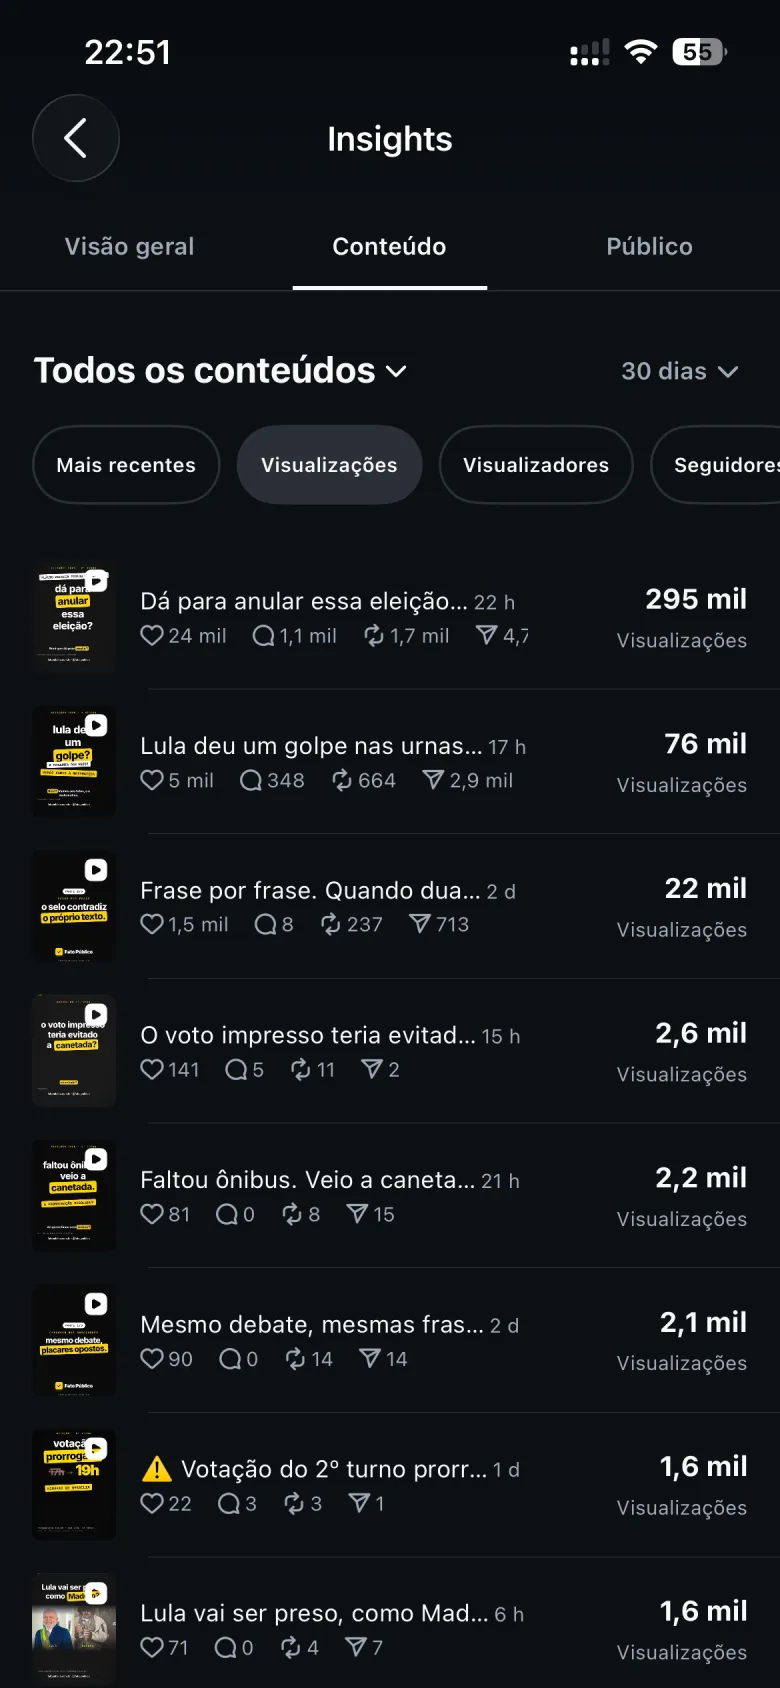
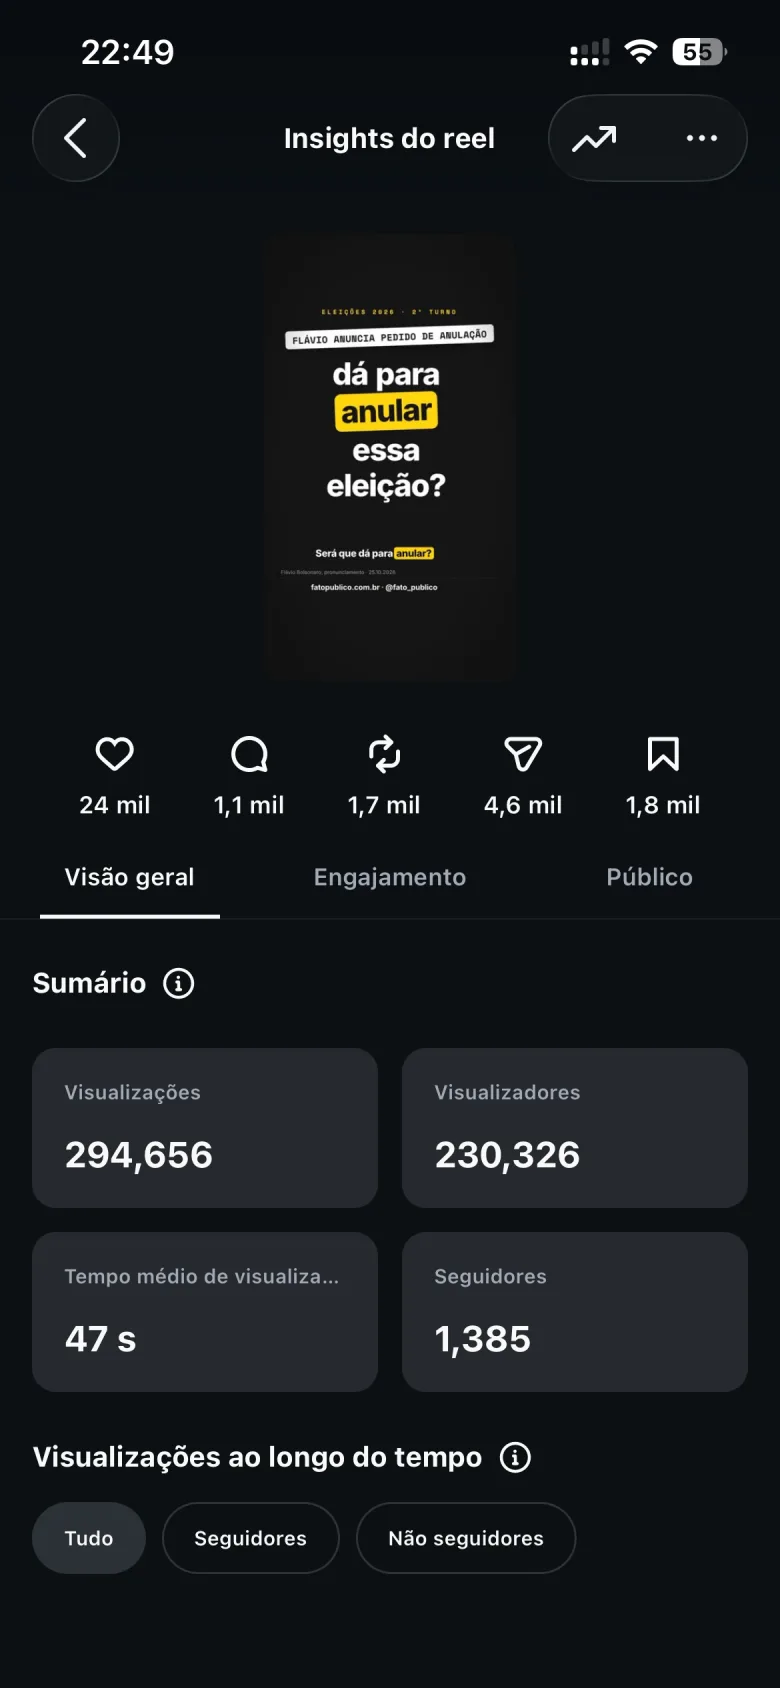
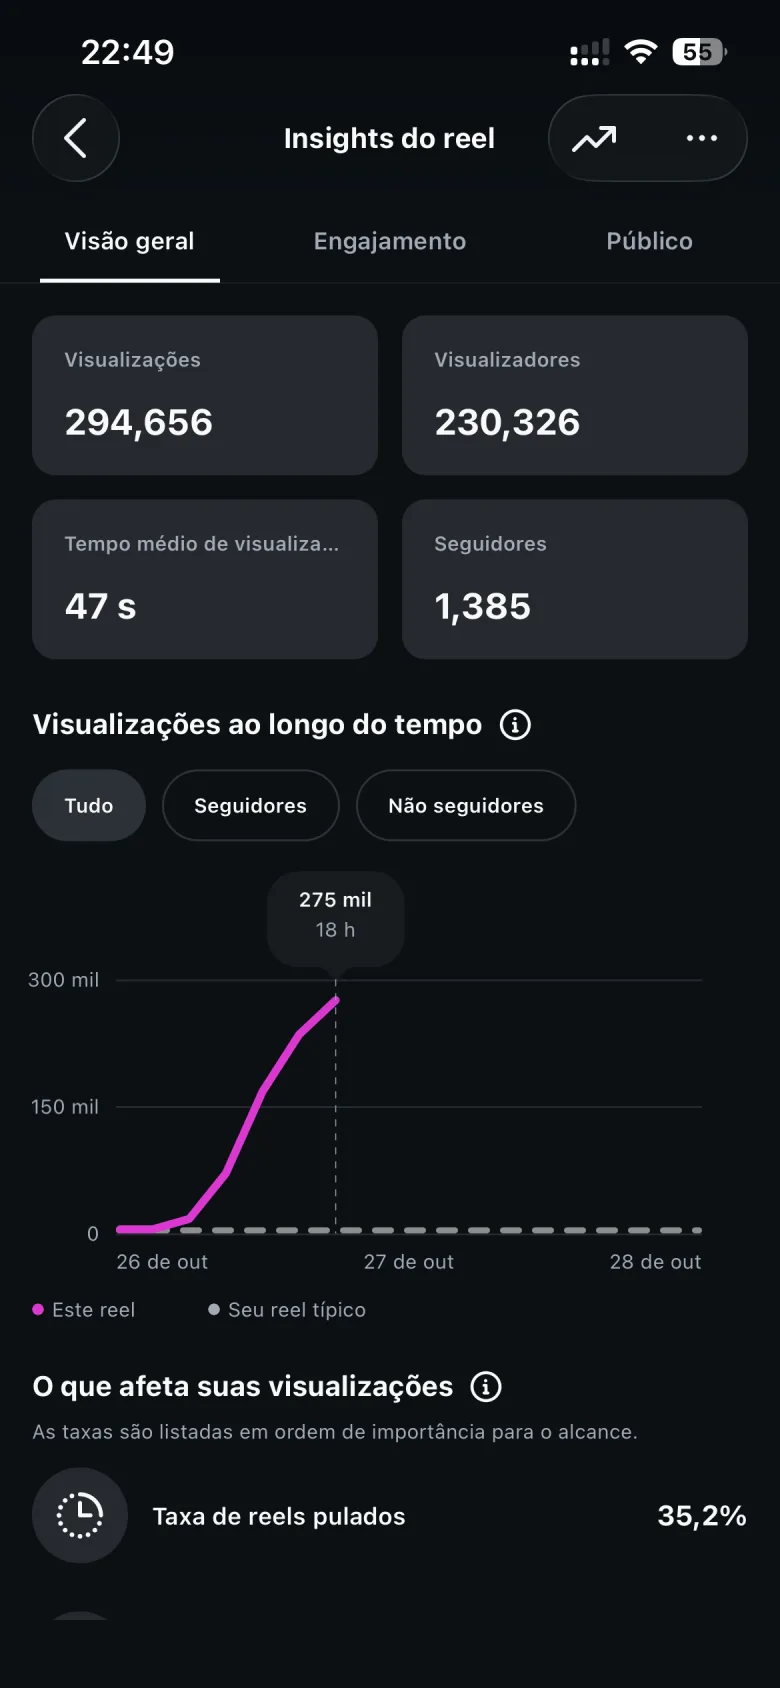
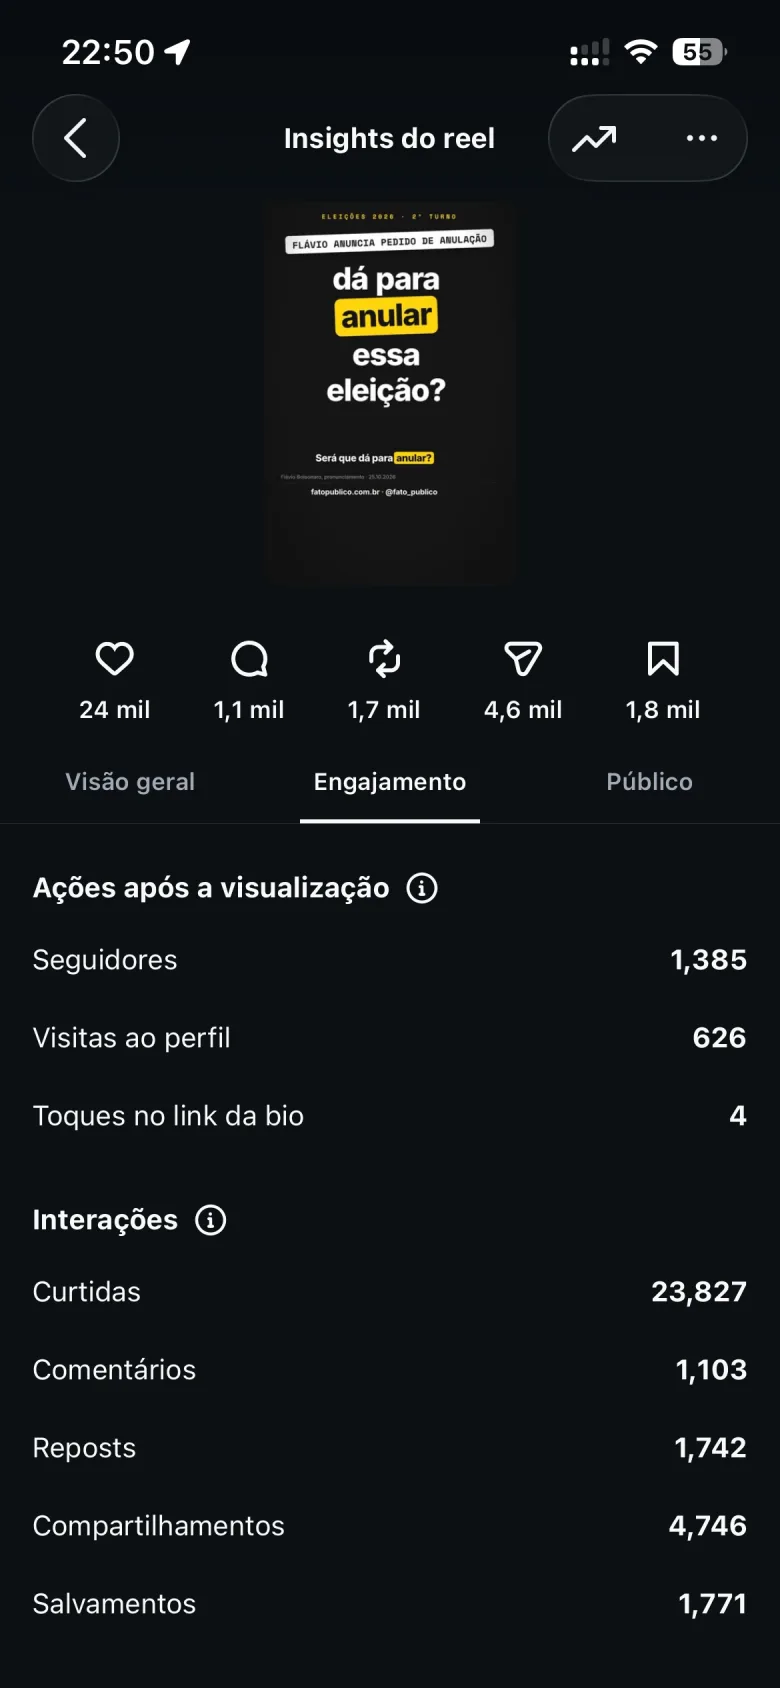
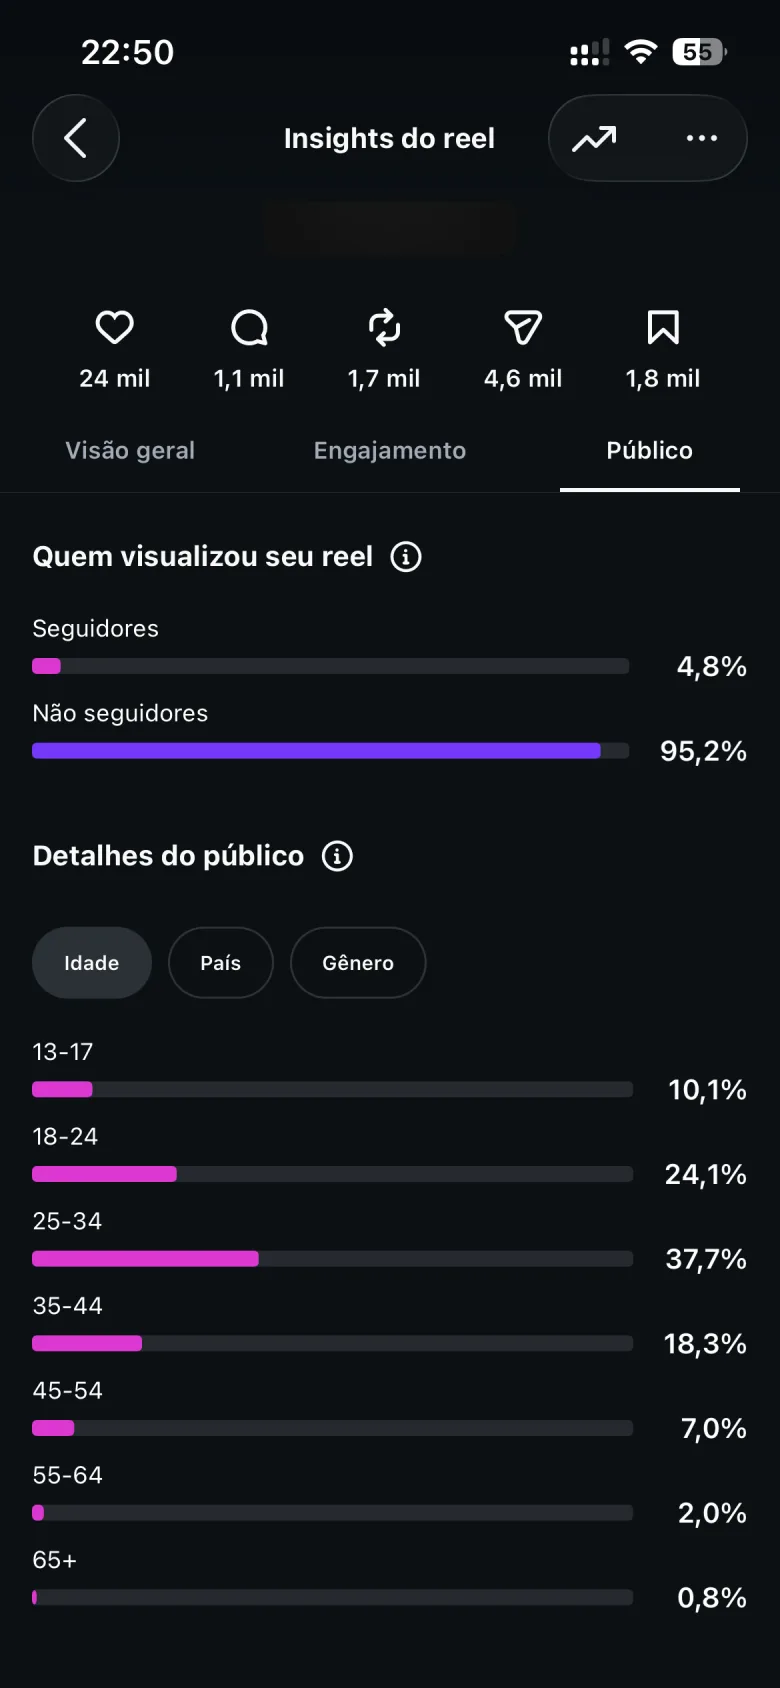
In the early hours after the runoff, calls to annul the election started trending. The Reel "Can this election be annulled?" answered with the law and the facts and reached 295k views in 22 hours, 95% of them from people who didn't follow the profile. It got 4,746 shares, 47 seconds of average watch time and 1,385 new followers.
Instagram · the profile's professional dashboard
After the election
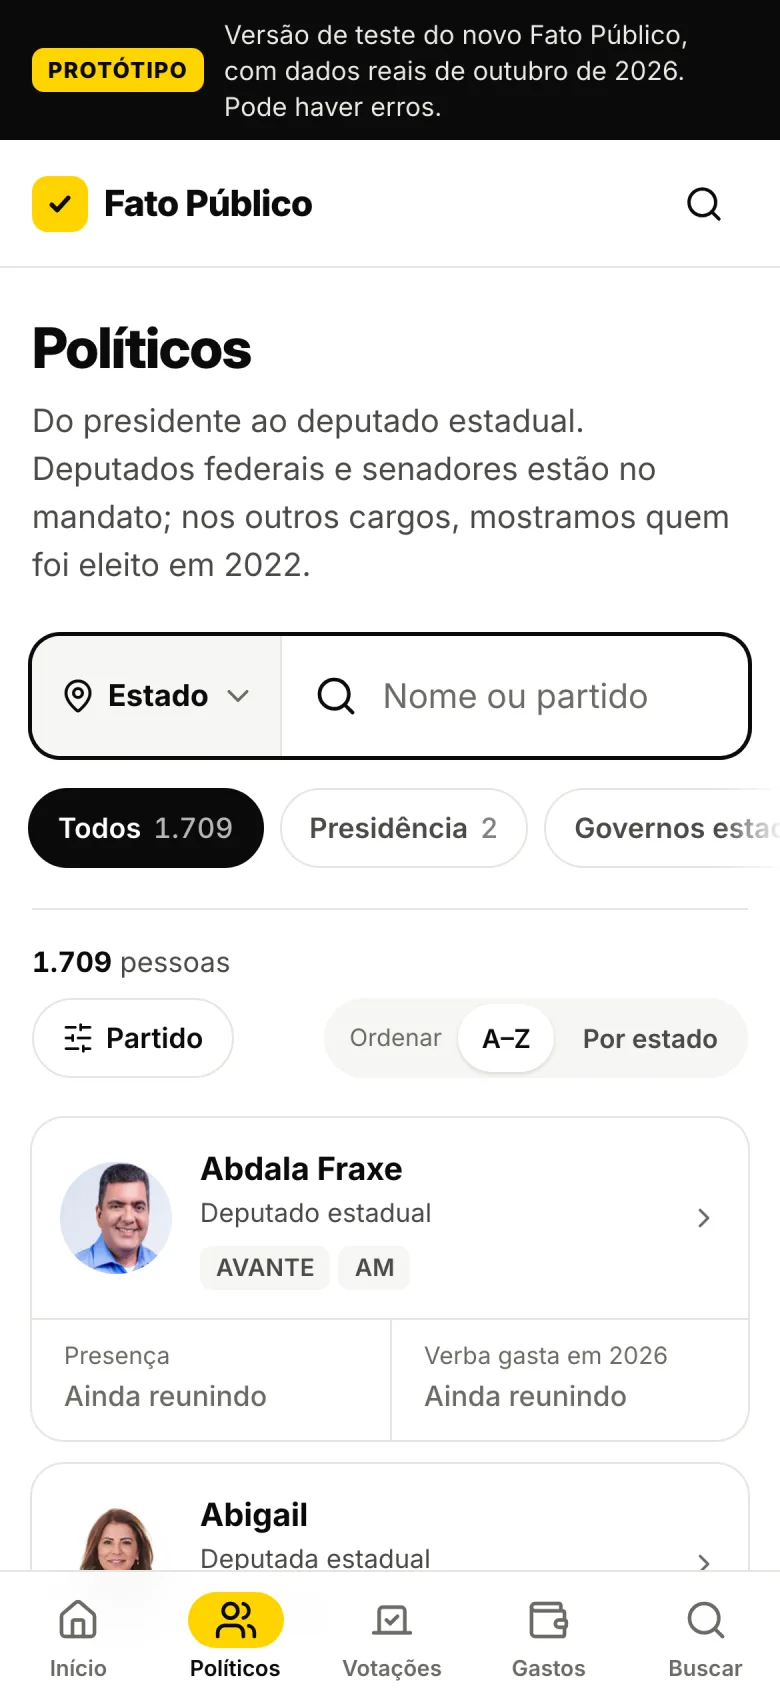
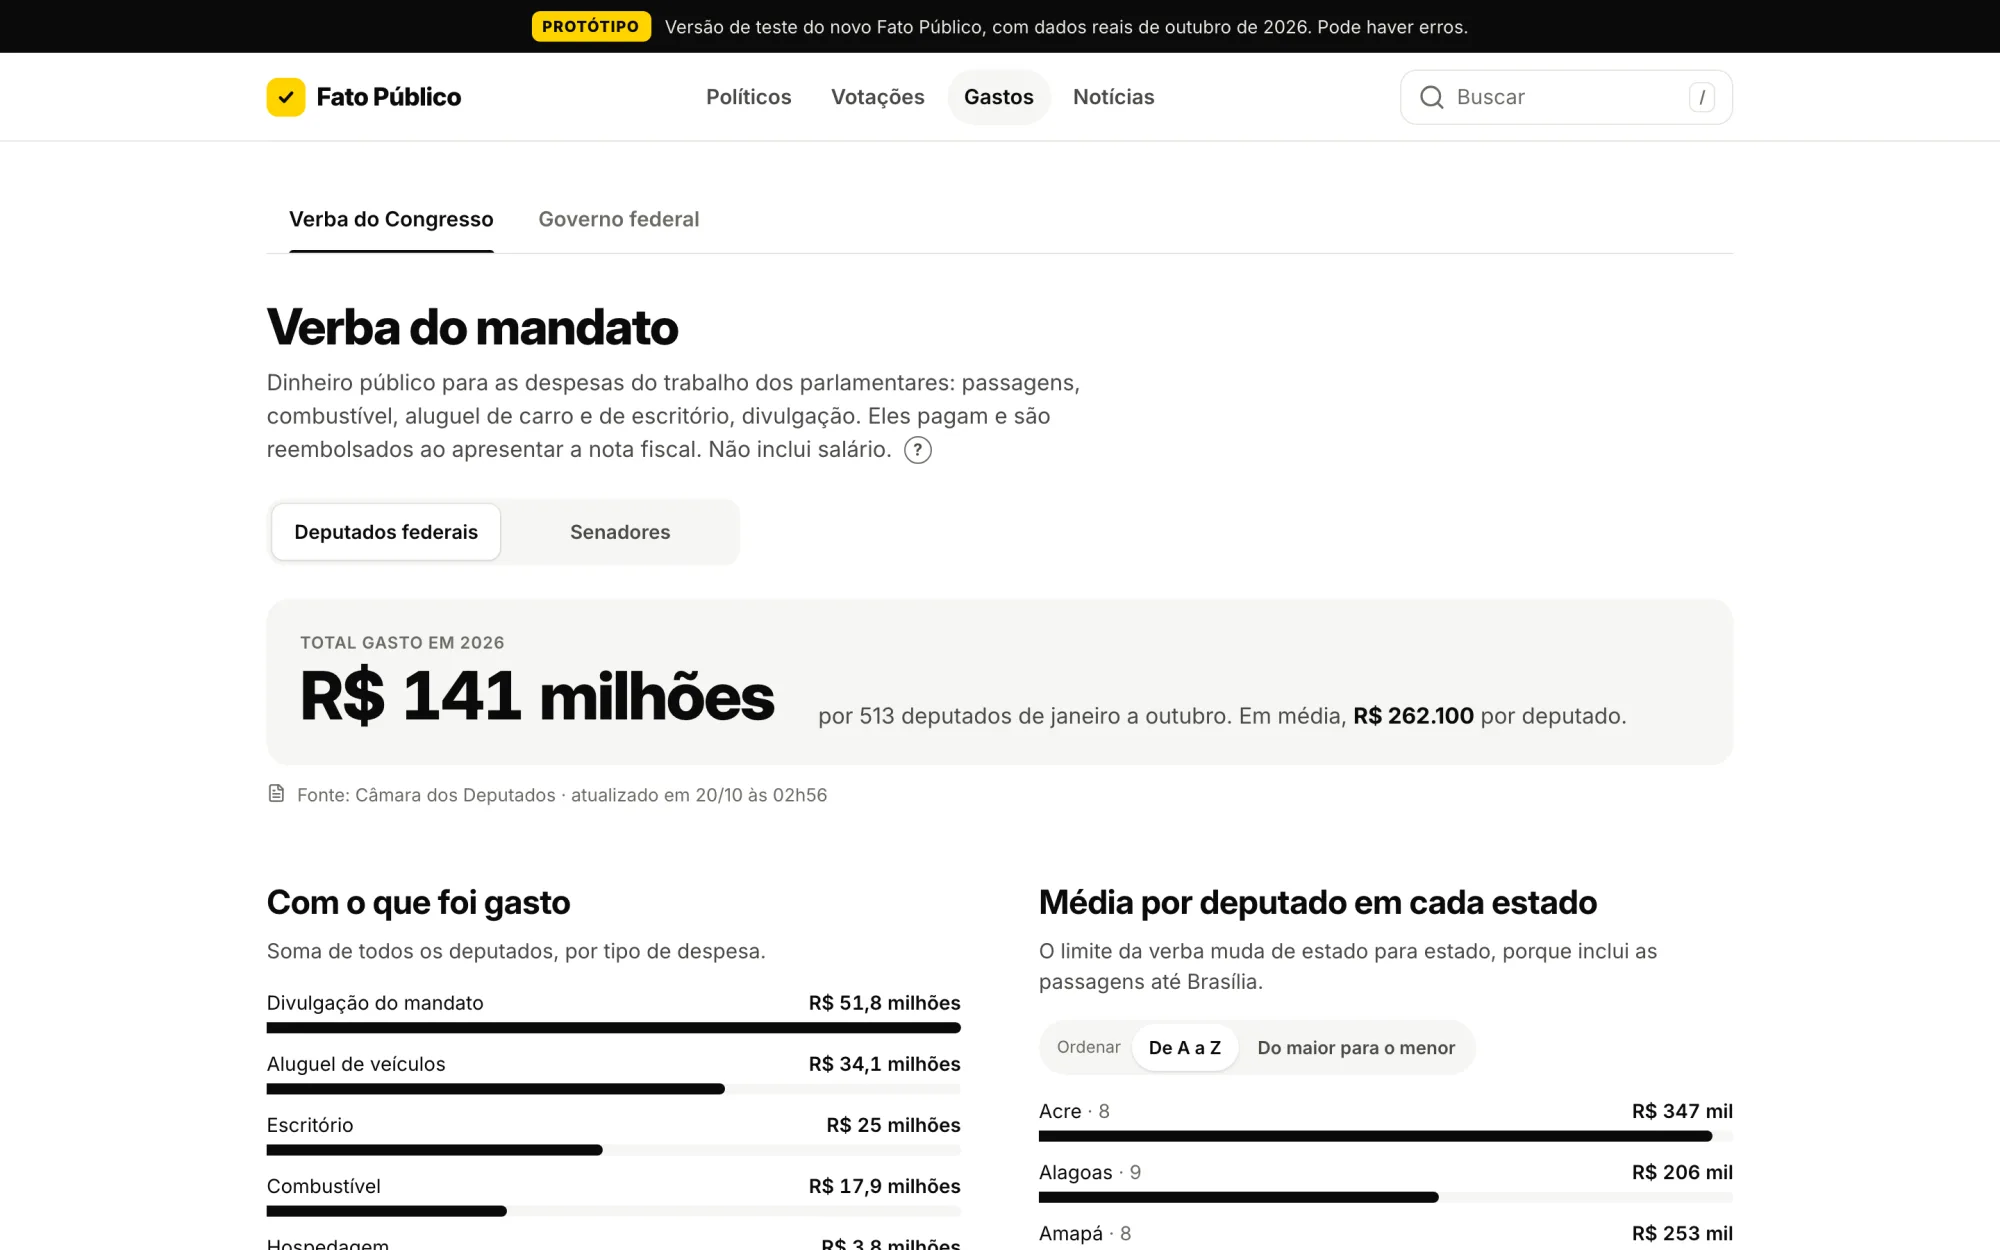
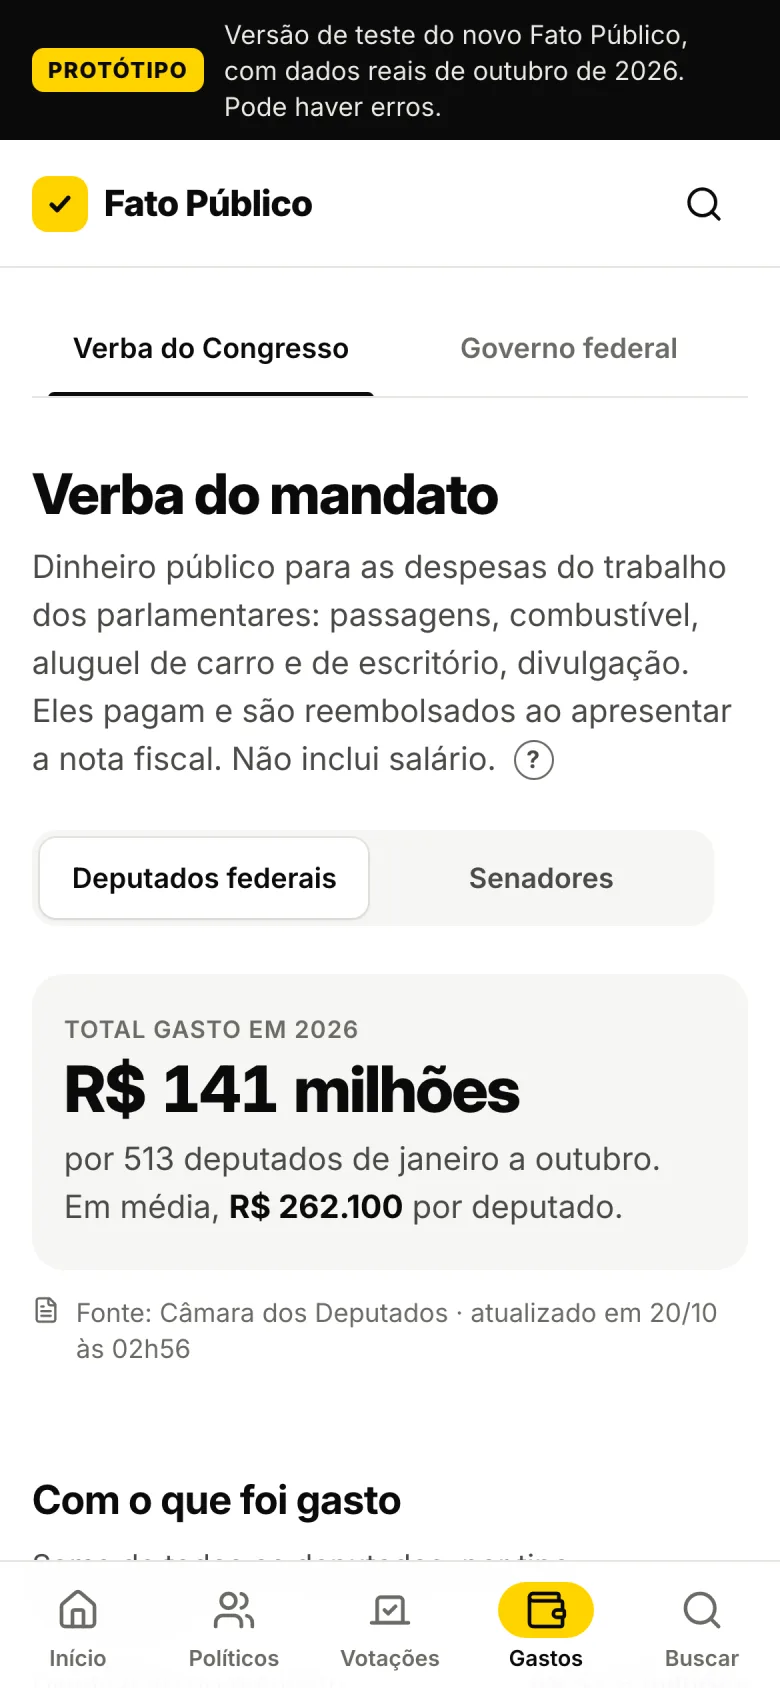
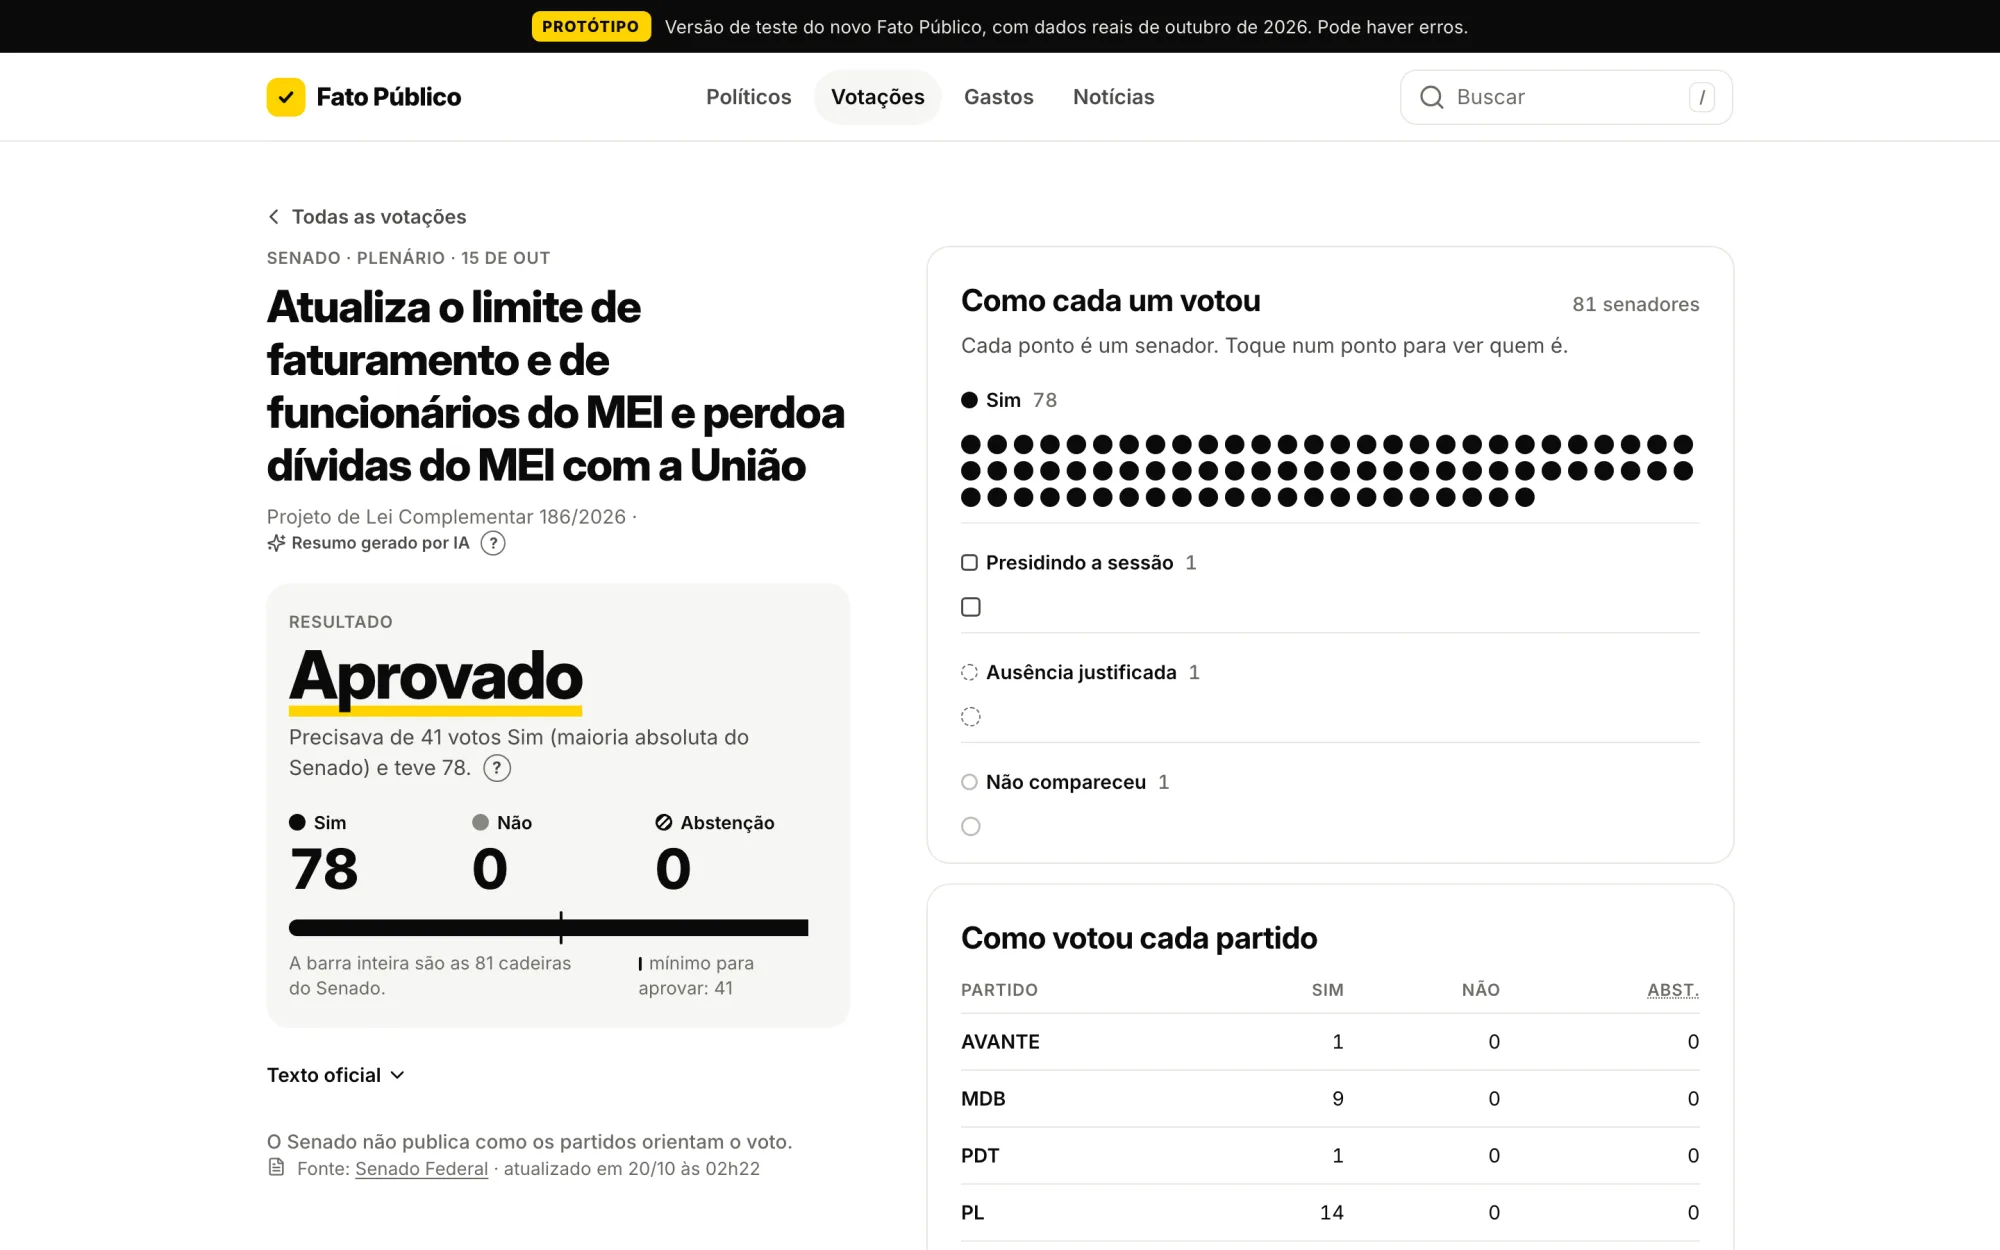
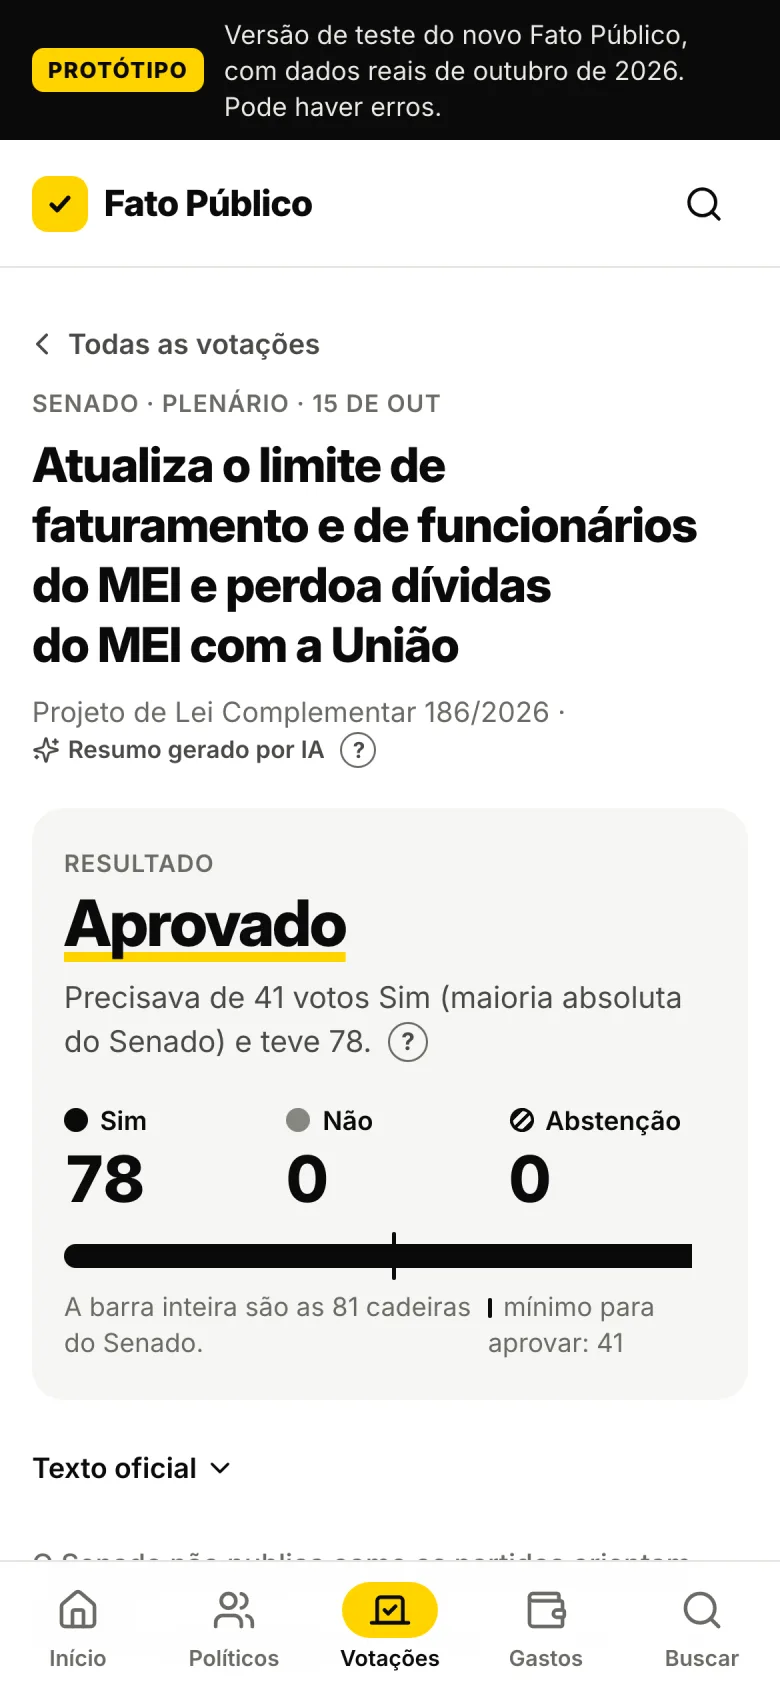
The election is over; the questions remain. Fato Público is becoming a public-data portal built around four answers, all drawn from official sources (the Chamber of Deputies, the Senate, the TSE and the federal government):
- Who represents me? By ZIP code or city, every elected official serving your area, from city council member to president.
- How do they vote? Every roll-call vote in Congress, with each legislator's vote and the party's guidance.
- How much do they spend? The congressional expense allowance by category and vendor, and budget amendments, following the money.
- What happened? Official news, with no opinion.
The prototype already runs on real data. Phase one launches in November–December 2026; phase two, when the newly elected officials take office on February 1, 2027.
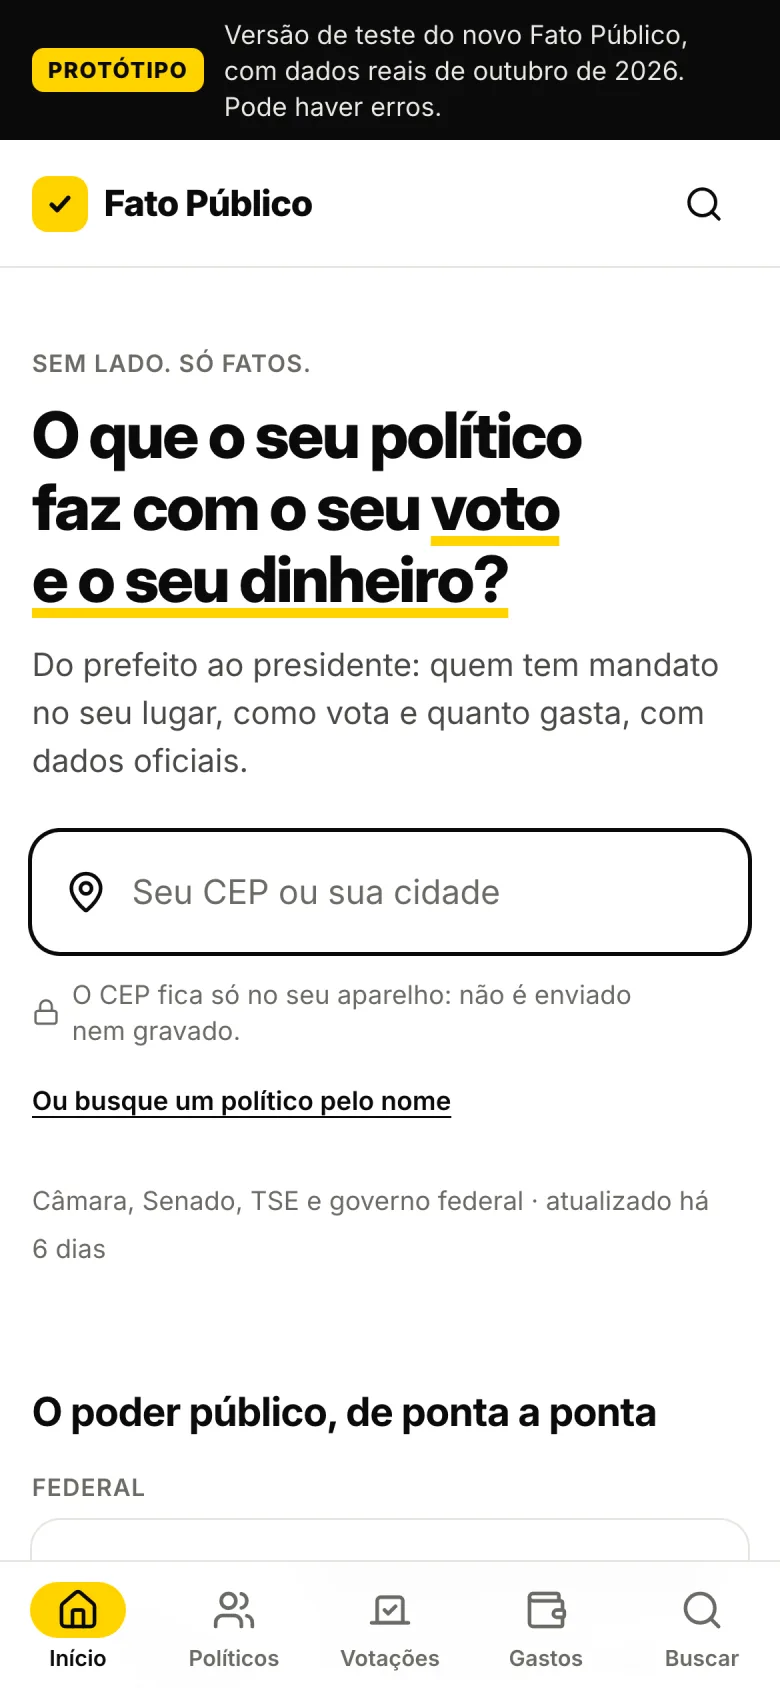
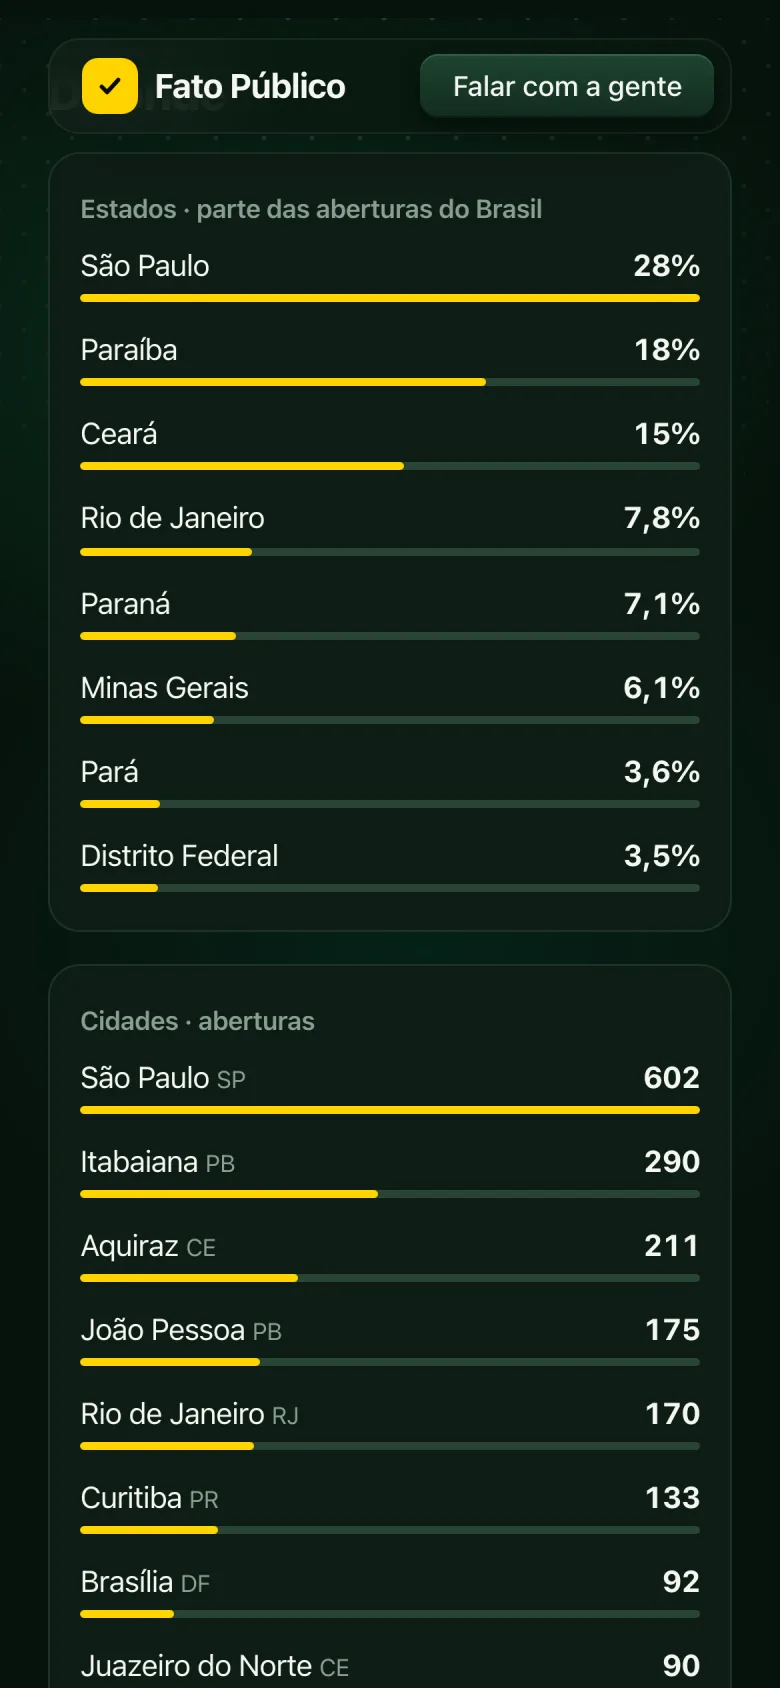
Politicians · all 1,709 in office, by position, state and party
How it was built
One designer, an AI pair and no framework. I wrote the product with Claude Code as my pair programmer: I decided what to build and how it should look, reviewed every change and tested it in the browser before shipping. That added up to nearly 200 commits in 23 days, from Urna de Treino to the final result.
- Privacy by default. Cookie-free counting, and alert sign-up emails deleted as soon as the alert goes out.
- Security reviewed. An audit before election night found four medium-severity issues, all fixed before October 25.
- Dress rehearsal. A local rehearsal mode, watermarked, simulated the entire night so I could test every state before it happened.
Takeaways
- Mobile is the product. Nine in ten people came on their phone. Desktop is the adapted version, not the other way around.
- Event audiences leave when the event ends. The peak lasted two hours, tied to the bulletins. The portal needs reasons for people to come back: alerts, email updates and data that changes every week.
- Reach came from answering fast. The top Reel went out hours after the question surfaced, with the law on screen. A fact checked at the right moment travels further than opinion.
- Privacy-friendly measurement is still measurement. With no cookies and no IPs, I could still see the night minute by minute. And counting people, not page views, keeps you from fooling yourself with your own numbers.
- AI speeds things up; judgment decides. Writing code got fast. What took time was deciding what to leave out, and holding to the neutrality rules in every detail.
Next case study
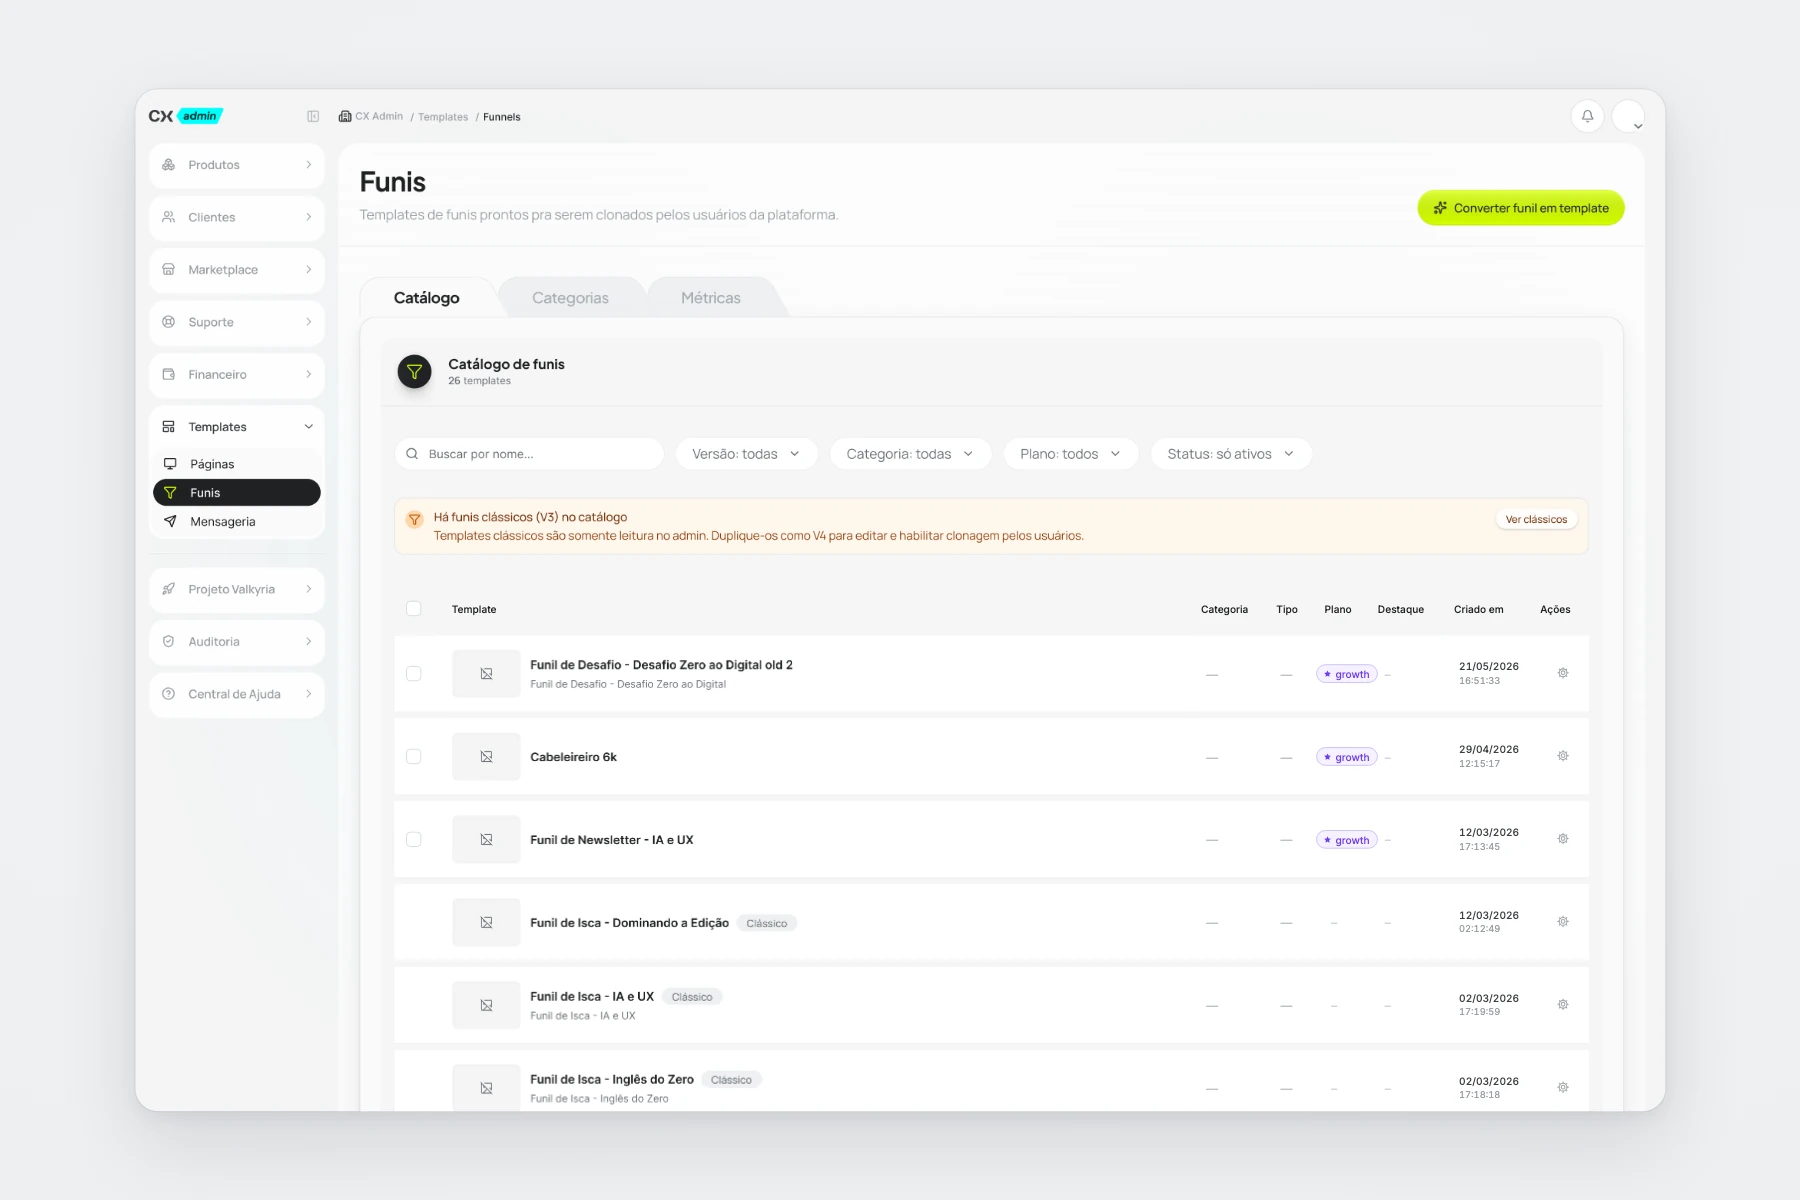
Clickmax · CX Admin
Unified navigation and funnel templates in a self-service flow.